Back in the day, retailers used to rely mostly on their instincts and hunches to make decisions about their business.
This included determining what product to market, where to sell, which audience to target, etc.
But, with the retail market size touching $18.33 billion by 2028, this is no longer helpful. Especially, since customers have so many alternatives and businesses generate way too much data for a human to calculate.
This is where data analytics for retail walks in and helps you to simplify the job.
Thanks to retail data analytics, managers and business owners can make informed decisions backed by reliable data. This includes decisions around business promotions, supply chain, inventory management, and so on.
If you are still not using data analytics software to track your data, then take this article as a reminder.
Let’s start by understanding the benefits of retail data analytics.
Top 7 benefits of data analytics for retail
Data analytics offers several benefits for retail businesses. Let’s list them out one by one:
Enhanced customer understanding
By analyzing purchasing patterns, preferences, and demographic data of their customers, businesses can easily tailor their marketing efforts and product offerings, and target customers to satisfy their needs.
This overall results in higher customer satisfaction, loyalty, and repeat purchases.
Improved sales and revenues
Using data analytics, businesses can leverage the power of retail sales analytics and productive analysis reports to forecast demand accurately. This helps optimize inventory, ensuring nothing is over or under-stocked. It also helps with pricing strategies.
Optimized pricing strategies
In the above point, we discussed how retail store analytics can enable retailers with their pricing strategies. Let’s take it further here.
Data analytics helps business owners monitor their competitors’ pricing, review product performance to evaluate market data, and adjust pricing strategies dynamically to remain competitive while composing with profitability.
Better product management
By regularly analyzing product performance metrics, say, sales frequency, customer feedback, and seasonal trends, retail businesses can manage their inventory better.
They can further customize their product offerings to optimize their sales.
Enhanced marketing effectiveness
Segmenting customer data is the first step towards an effective personalized marketing campaign. You need to go deeper into your customers’ data to identify similar characteristics and trends to target them better.
This also helps in increasing engagement and conversion.
Improved customer retention
By analyzing customer data and personalizing their approach according to the trends and patterns businesses can easily increase customer satisfaction. They can also use loyalty programs or specific deal counts to improve customer retention, foster long-term customer relationships, and increase recurring purchases.
Actionable insights and reporting
Real-time data analytics and dashboards can provide retail business owners with actionable insights into the various operations of the business.
Whether it is customer details, sales performance, product management, or inventory turnover, they can easily glance at information and make quick decisions to ensure operational agility.
Overall, retail data analytics empowers businesses to make impactful decisions.
Challenges faced by retail businesses
Data analytics in retail industry has substantial benefits but it is followed by several challenges.
For example:
- Data quality and consistency
- Data security and privacy
- High implementation costs
- Complexity of data analysis
- Resistance to change
Let’s discuss them in detail.
Data Quality and Consistency
One of the major issues retailers can face while implementing data analytics in their business is incomplete, inaccurate, or inconsistent data especially if you are selling from multiple sources.
And therefore, it becomes important to ensure data quality and consistency across all the sources to make reliable business decisions.
Data Security and Privacy
While handling sensitive customer information businesses need to ensure that they comply with privacy regulations like GDPR or CCPA and have enough protection against data breaches.
High implementation costs
Setting up data analytics software in your business significantly costs a fortune.
This is especially true if you are acquiring complex software that requires hiring skilled personnel to ensure a smooth transition and proper software adaptation.
This becomes even more gruesome for small to medium-sized retailers who need help to justify these expenses.
Complexity of data analysis
Data analytics for retail businesses can be vast and complex.
This involves pulling data from sources like sales transactions, inventory records, customer interactions, etc. ensuring that this information is reliable and accurate becomes a headache easily.
Resistance to change
Last but not least, is the challenge a business owner faces while adopting data analytics software.
The sense of unfamiliarity with the tool and fear of change can be overwhelming. Overcoming this resistance and fostering a data-driven culture is essential for success.
To address these challenges one needs a strategic planning investment in technology and proper training.
While it may be hard to switch to data analytics software initially, remember that retail business owners can get so much more by using the power of data analytics.
Putler – The best retail analytics tool for retail business?
Now that we have discussed all the benefits and challenges of data analytics for retail businesses, let’s talk about – THE SOLUTION.
Introducing Putler.
Putler is one of the best retail analytics tools for all your data woes.
To be precise, it is a comprehensive eCommerce analytic tool that offers a range of features designed to optimize different aspects of your business.
Let’s know them further.
Multi-store reporting
In the challenges, we discussed how difficult it is for one to ensure accurate and reliable data especially when selling from multiple sources. Guess what, Putler addresses this issue in the best way.
Yes, Putler allows integrations with 17+ data sources. These include:
- Top payment gateways like PayPal, Stripe, Braintree, Authorize.net, Sage Pay, 2Checkout, and Razorpay.
- Top shopping carts & eCommerce platforms like Shopify, WooCommerce, Bigcommerce, Easy Digital Downloads, eBay, Etsy, Gumroad, and Amazon.
- Google Analytics & MailChimp.
- Moreover, if you have data sources that Putler doesn’t directly integrate with, then you can use the Putler API to bring in data from such sources.
It pulls data from various solutions and integrates them into a dashboard to give you a unified view on your business.
It also cleans and enriches your data to ensure zero spam and high accuracy.
Customer segmentation
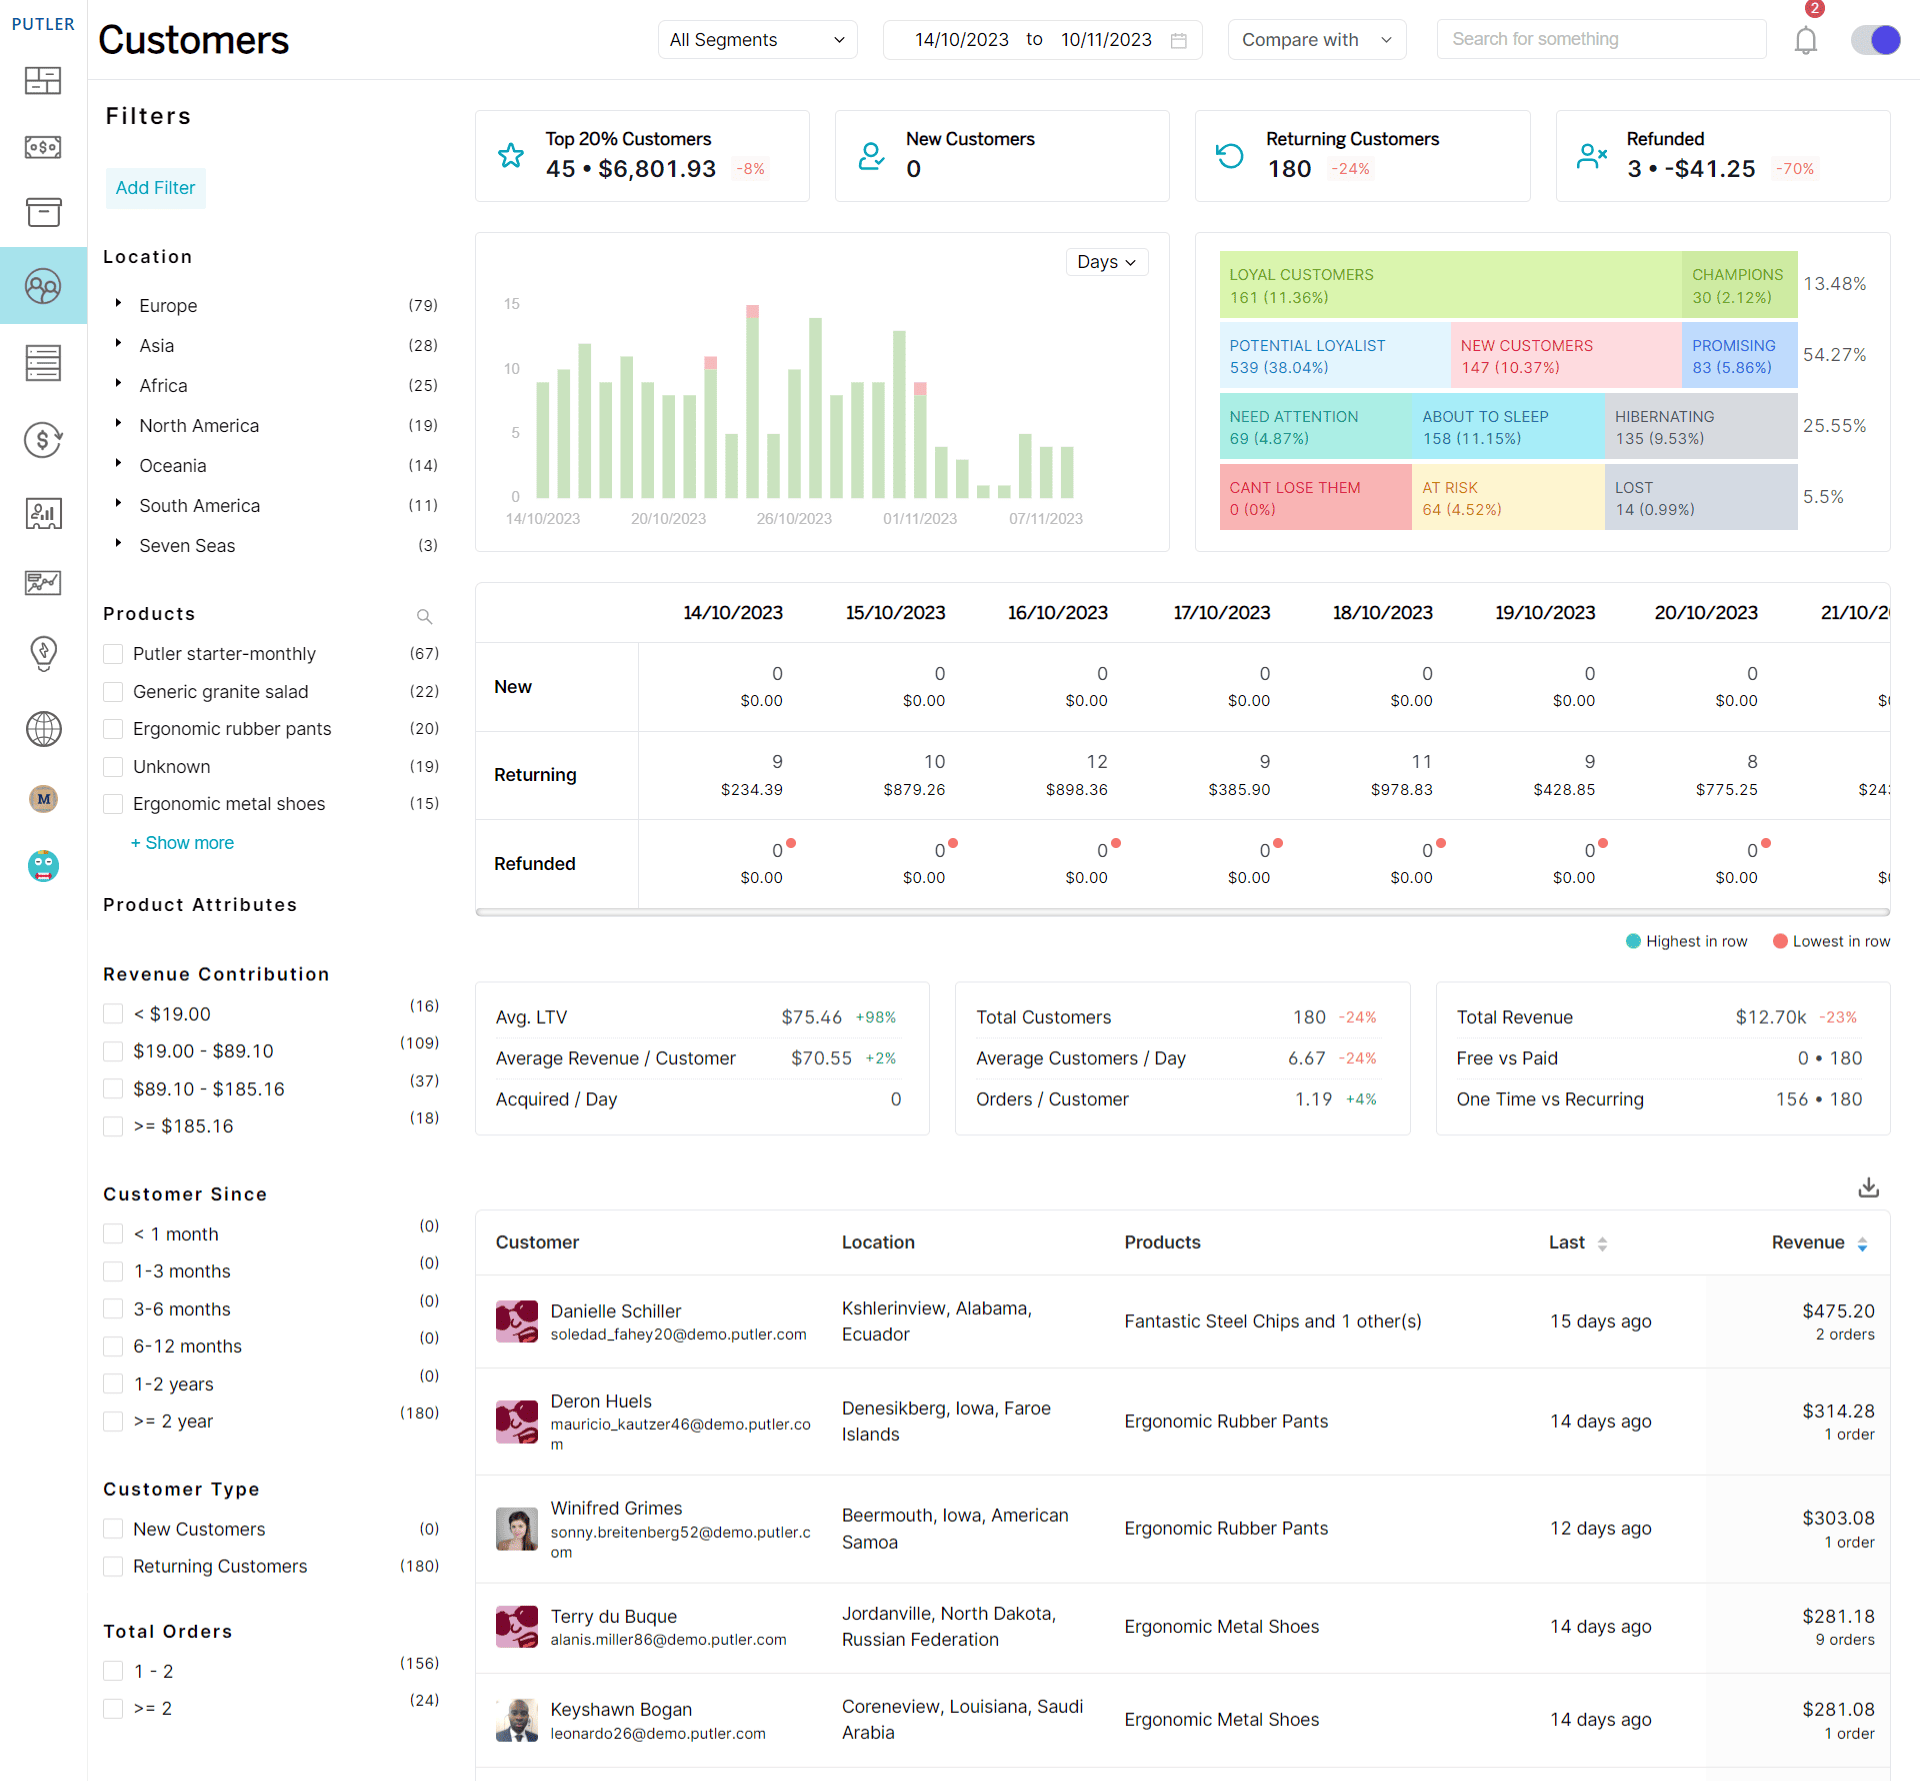
Putler comes with advanced customer segmentation capabilities including RFM segmentation, multiple filters, detailed customer insights, and so on.
It allows you to segment your customers based on multiple parameters, such as demographics, products, revenue, customer type, join date, number of orders, shopping attributes, and the list goes on.
RFM segmentation, on the other hand, works wonders when it is about understanding your customers based on their purchasing behavior.
RFM helps identify loyal customers, customers on the verge of losing, and those likely to churn, segmenting them into 11 segments for a pinpointed approach.
This enables you to rethink targeted marketing and personalized customer engagement.
Product performance reporting
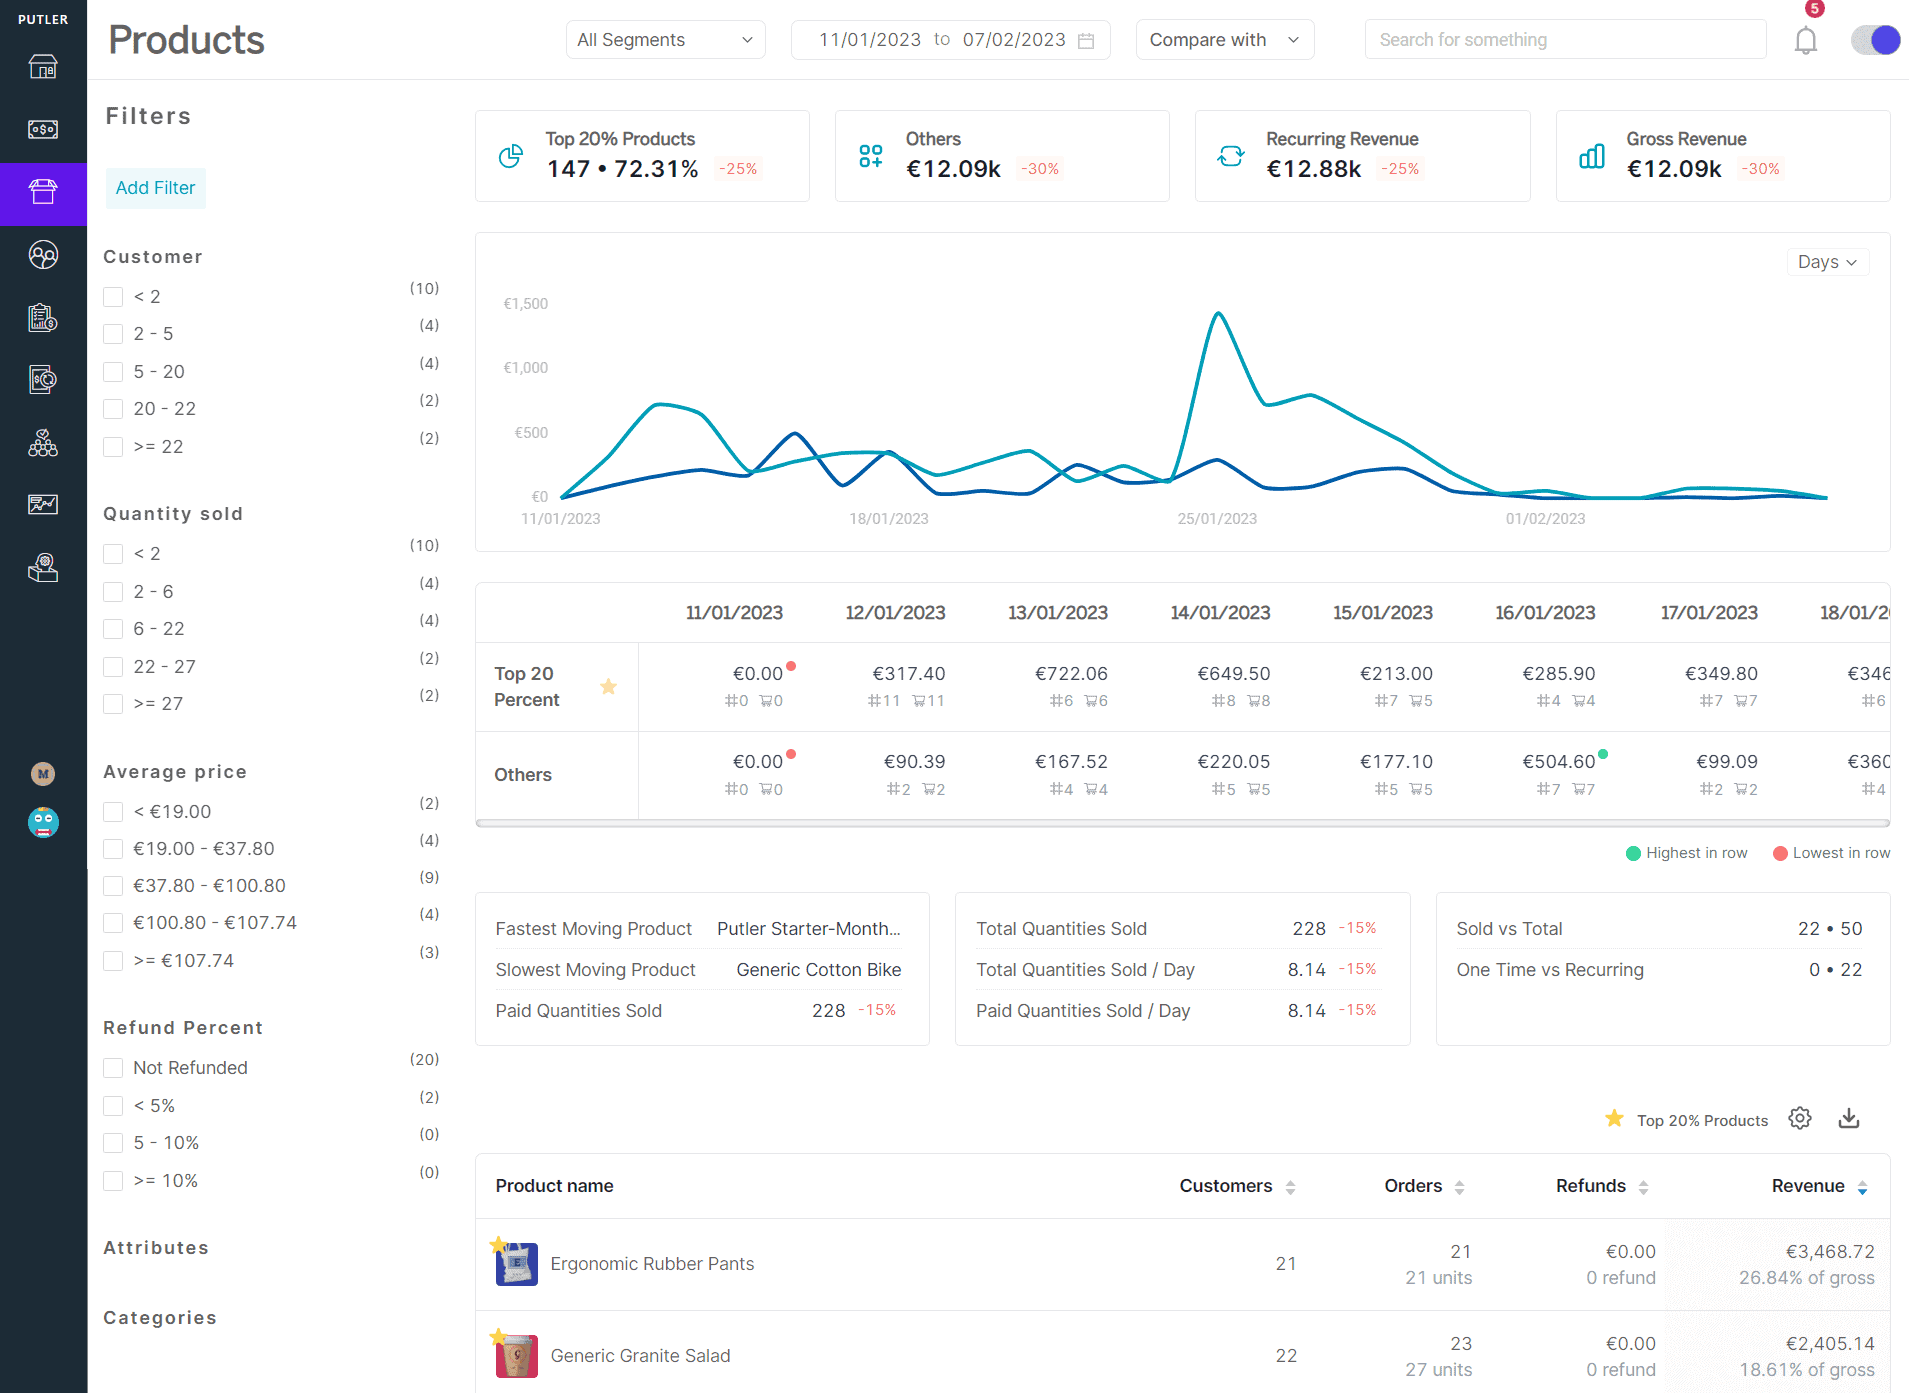
Putler offers a dedicated dashboard for products. This dashboard provides a clear view of different products and how they are performing.
Whether it’s sales trends or identifying top products, Putler allows you all the required information.
By looking into details like top products, highly refunded, top 20% products, and frequency of products, you can understand how well a product is performing compared to others.
This helps you with inventory management and ensures that you are not over or under-stocking products.
Marketing campaign performance check
Although Putler can’t help you directly analyze your marketing campaigns, it can still make you aware of the vital aspects, sales-wise.
Yes, it can help you understand how well customers have responded to your marketing efforts and find areas to improve.
Here are different ways you can do this:
- Keep a tab on performance indicators such as sales volume, revenue, and website metrics to determine how your marketing campaign performs.
- By identifying and analyzing purchase patterns and sales trends for an increase in revenue you can understand if the campaign was effective.
- You can even compare your business metrics from a period before you started the campaign to a period after it has ended.
Operational efficiency enhancement
Another advantage of Putler is that it helps in enhancing operational efficiency.
Think about exporting data from multiple sources and importing it on software to view insights. Sounds troublesome right? Of course, it is. It is a time-consuming process.
But Putler cuts everything short by pulling data from multiple sources automatically, deduping them, thus simplifying your job.
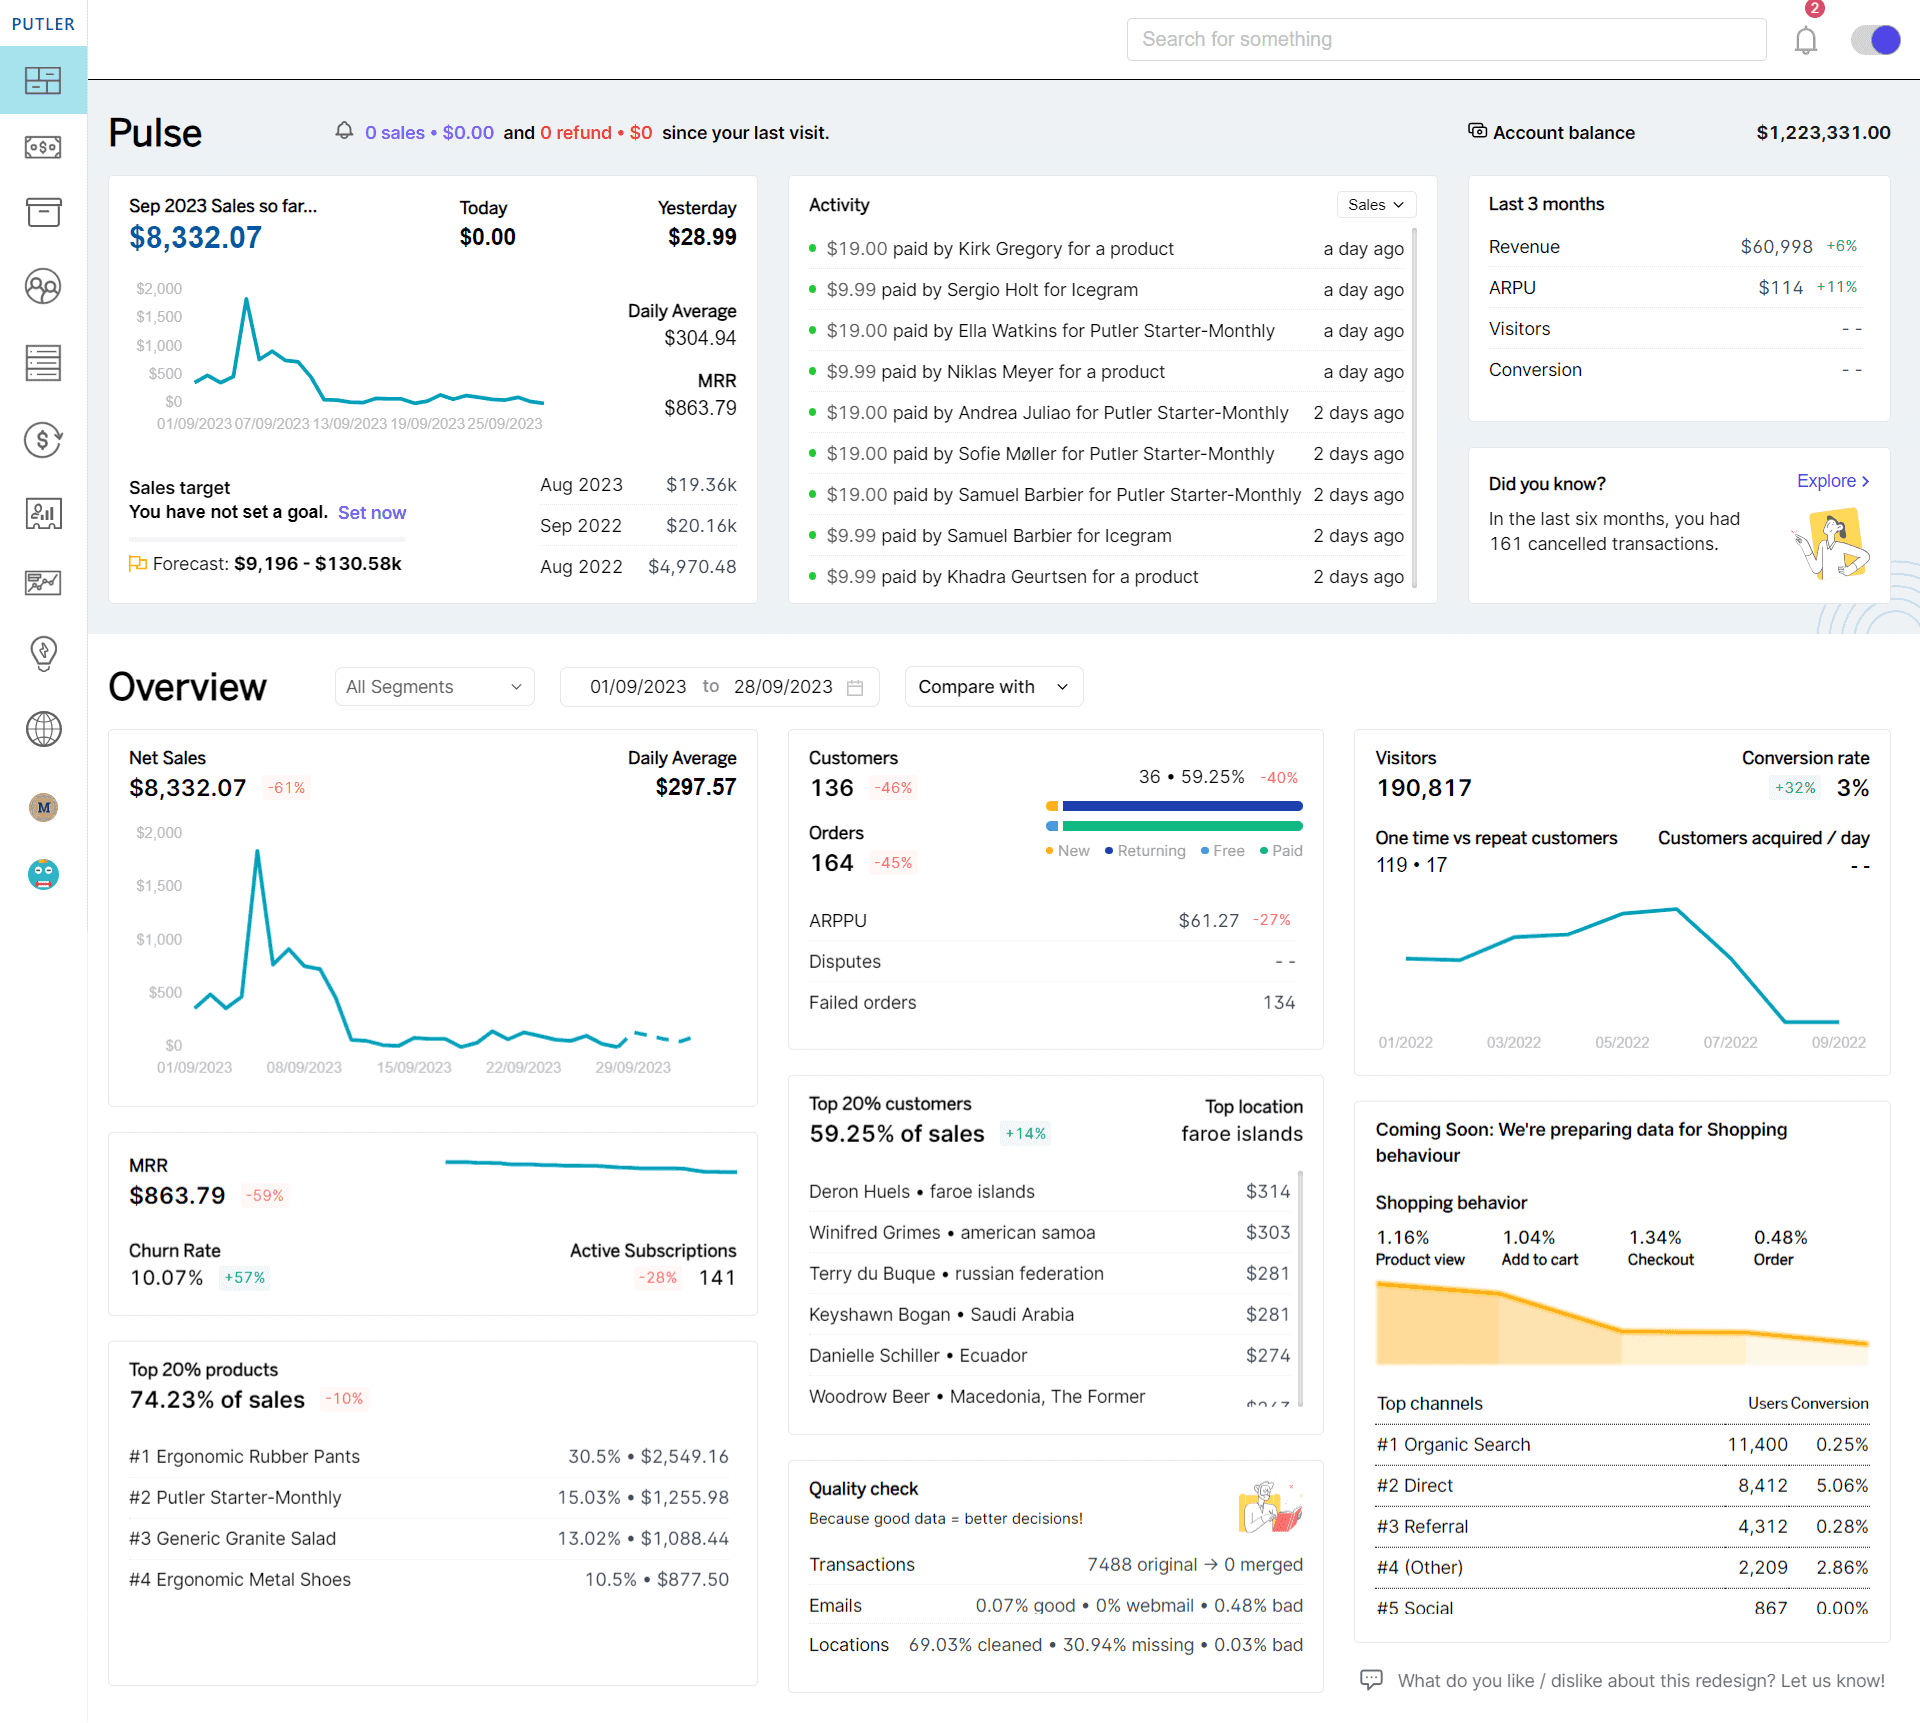
Additionally, it provides real-time data insights.
This means you have everything under your control and can take immediate action when the time comes.
This streamlined approach boosts productivity and drives operational excellence within your retail business.
Weekly Email Updates
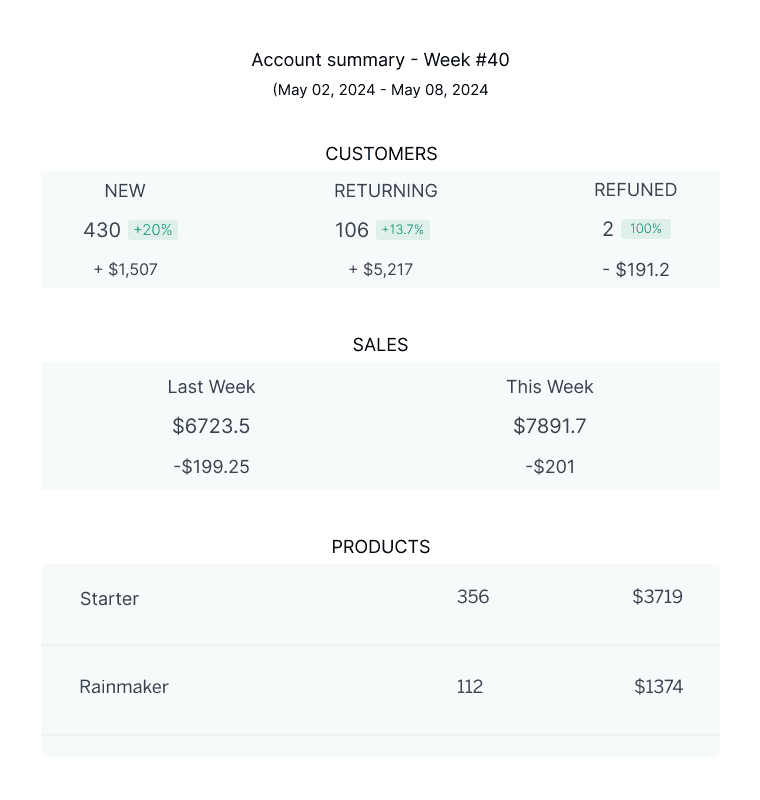
Putler sends weekly email updates to the business admins.
These emails contain crucial data and statistics about the weekly business performance.
It also provides a snapshot of the business health and highlights significant changes or trends, giving you easy access to vital information and saving time.
With this, you can stay informed about your business even if you are away from the keyboard and make decisions quickly.
Alternatives to Putler for data analytics for retail business
Here are some top retail analytics platforms:
Google Analytics
Google Analytics is one of the most popular web analytics tools.
It caters to a wide range of industries, including retail businesses.
It helps you to track and analyze your website traffic and user behaviors. It provides valuable insights into your visitors and helps optimize your online presence.
Highlights:
- Comprehensive website traffic analysis
- Customizable dashboards and reports
- Integration with other Google services, for example, Google Ads, Search Console
- Real-time data tracking
- User demographics and behavior insights
Pricing:
Google Analytics is a free tool suitable for businesses of all sizes.
Looker
Looker is a data exploration and business intelligence platform.
It allows retailers to export data on the solution to explore, visualize, and get a centralized view of it.
It empowers retail business owners to make data-driven decisions and streamline different aspects of the business.
Highlights:
- Visualize your data with interactive charts and tables
- Connect with multiple sources
- Share your insights with your team
- Collaborate with your team on various reports
- Use in-built sample reports in the report creation process
Pricing:
- Viewer user: $30/user/month
- Standard user: $60/user/month
- Developer user: $125/user/month
Tableau
Tableau is one of the leading data visualization and retail analytics tools.
It is an easy-to-use self-service data analytics software that allows you to upload data on the cloud platform. Post that, it turns that raw data into actionable insights.
Through the interactive dashboard and visual analytics, retailers can easily make data-driven decisions and uncover hidden patterns in their business.
This supports businesses to grow, and drive innovation through better and informed decision-making.
Highlights:
- Interactive and informative dashboards
- Supports different data sources like local files, spreadsheets, relational and non-relational databases, data warehouses, big data, and on-cloud data
- Easy to share and communicate with team members
- Highly secure and reliable
- Advanced visualization features
Pricing:
- Creator: $70/user/month
- Explorer: $35/user/month
- Viewer: $12/user/month
Final words
In conclusion, retail store analytics is a powerful asset for retail businesses.
It provides valuable insights, assists in making strategic decisions, and improves overall operational efficiency.
Choosing the right data analytics tool is essential to harness these benefits.
The right tool provides you with comprehensive and actionable insights and integrates well with your existing business infrastructure.
And if we talk about a product that has all of these features and is easy to use and adapt, then we will surely recommend Putler.
Putler is an excellent choice for retailers who want to leverage data for their business growth.
Try Putler today and find out how it can make a difference.