Business analytics tools are your daily necessity
Any online business needs to handle a lot of complex data. But doing it manually leads to inaccurate results, frustration and loss of productive time. Thanks to the various business intelligence tools available that perform this complicated tasks for you and provide you with accurate reports to make optimum decisions. Two such famous tools are-
Baremetrics vs Putler
Both these offer ample of features that helps businesses grow revenue.
So today, we do a complete Baremetrics review and Putler review.
Read below to find which one analytical tool suits the best for your business…
Don’t have time? Jump to Pricing & Overall Comparison
SaaS Metrics OR All Metrics?
Baremetrics has saas metrics
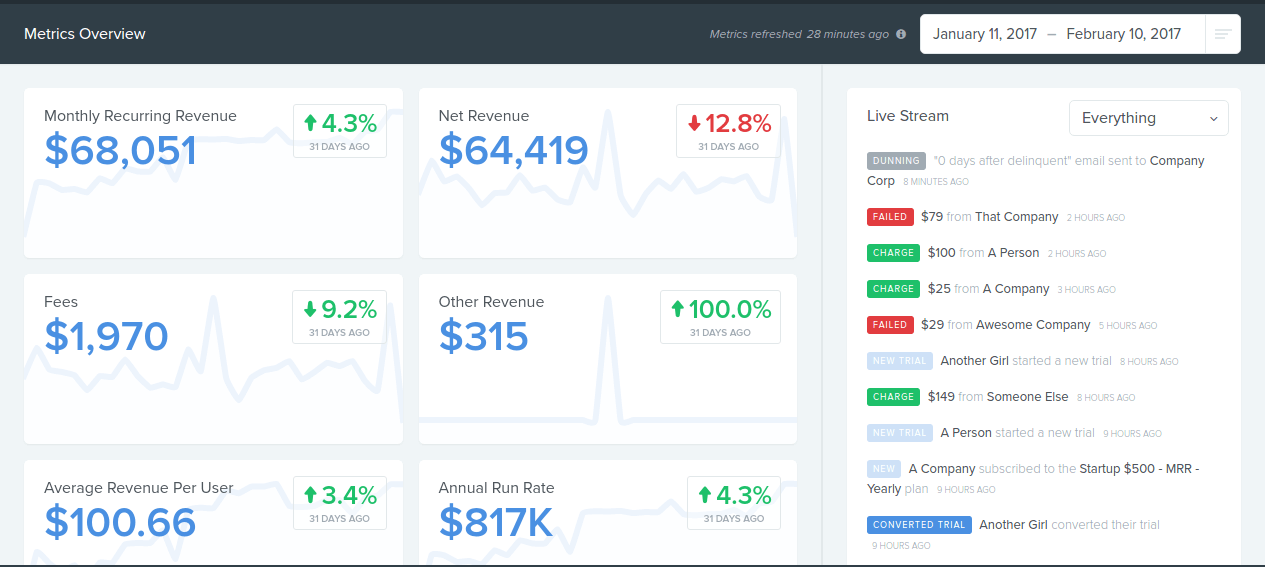
Baremetrics is a subscription analytics software suitable for businesses offering subscription products. It’s a SaaS analytics software. It shows all subscription related metrics such as Monthly Recurring Revenue (MRR), Customer Lifetime Value (LTV), Churn Rate, etc. which are useful for subscription businesses. For businesses which are not into subscriptions, these metrics are not much useful.
Putler has all metrics including SAAS
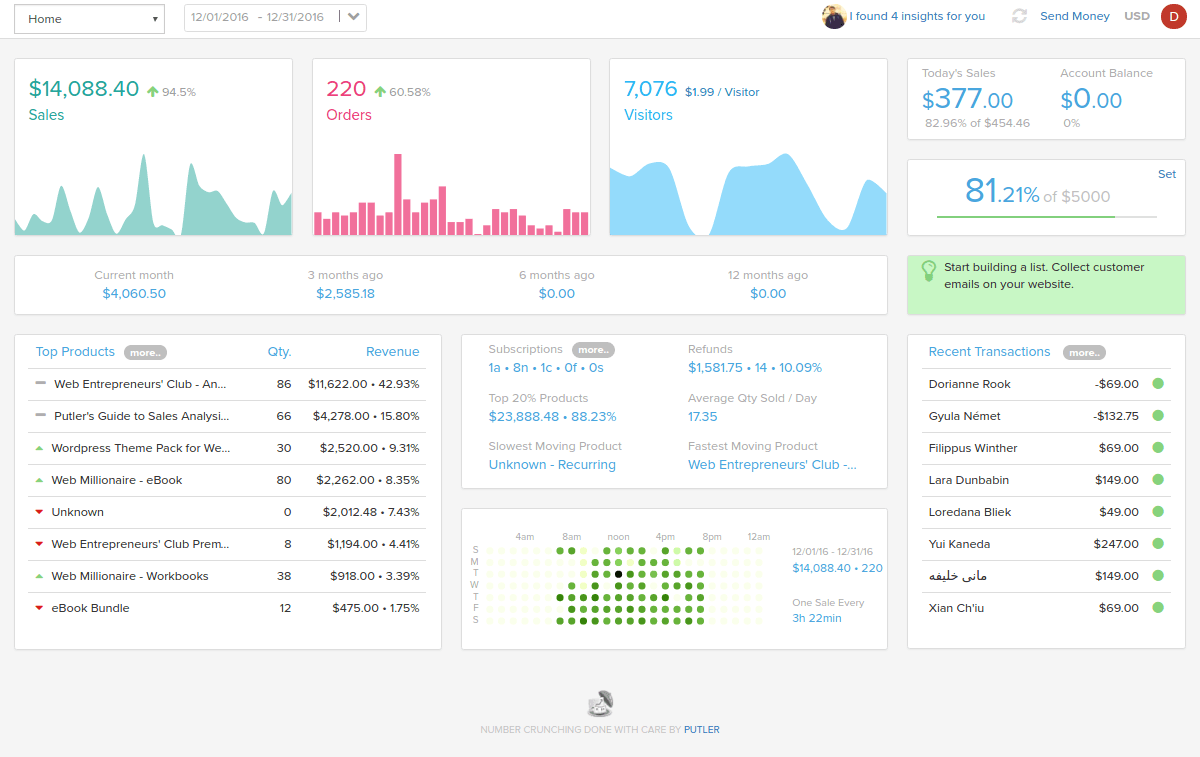
On the other hand, Putler is useful for not only subscriptions businesses but also other online businesses which are not into subscriptions. These includes all kind of online stores, startups, accountants, etc. Hence, Putler has businesses growth metrics for all. Metrics like total sales, best selling product, top customers, MRR, LTV, Churn rate.. a total of 153+ metrics.
Which Is Your Preferred Integration Platform?
Baremetrics has 4 integrations

Baremetrics began its journey with Stripe integration and provided Stripe analytics & Stripe metrics. Along with Stripe integration, Baremetrics added three more services- Braintree, Recurly & Chargify to the list. Furthermore, it added the Baremetrics API. PayPal support will also be added in the future. If you are using other services than the one mentioned above and need to pull data into these services, you need to use the Baremetrics API.
Putler has 15+ integrations
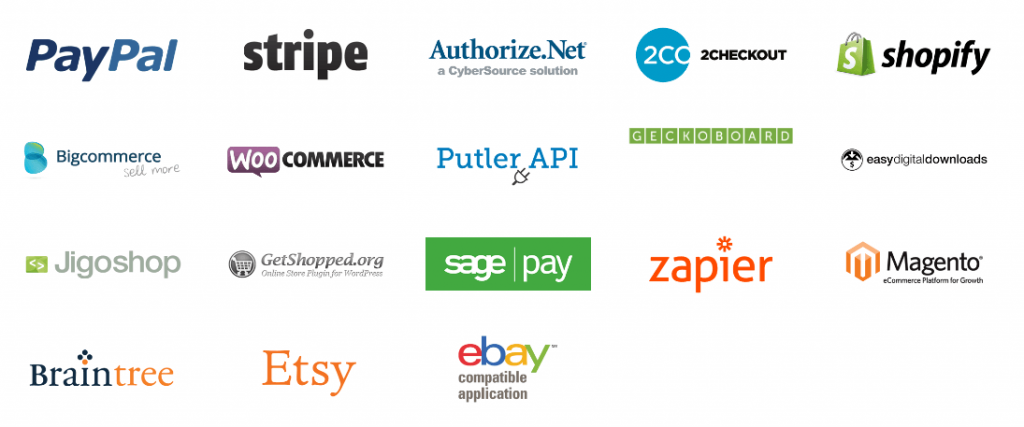
Putler began its journey with PayPal integration. It kept on adding more and more services and today, Putler directly integrates with 15+ services. These includes:
- Top payment gateways like PayPal, Stripe, Braintree, etc.
- Top shopping carts- Shopify, WooCommerce, Magento, etc.
- Ecommerce platforms like eBay, Etsy, etc.
- Google Analytics
In addition, Putler API enables you to connect to other services not mentioned above. Get all business metrics and reports by connecting any of your preferred one easily with Putler.
The Core Part – Features & Benefits
Consolidation
Your shopping cart or e-commerce platform lacks most up-to-date and accurate transactions data. A payment gateway is the most authentic source of transactions, but payment gateway does not have sufficient product and customer data. Even small errors and omissions would give you a skewed picture of your business. You can’t rely on a single source of data. For accurate business reporting, you must consolidate.
Deduping
Connecting multiple data sources leads to data duplicates which can cause error in total count- be it sales or orders if not taken care off. Hence, deduping process is a must to remove duplicate data entries and present only single relevant entry.
Baremetrics
You can connect multiple data sources into Baremetrics. But, combining different sources won’t let you see metrics for individual data source. You would see only combined stats for all data sources connected.
Putler
With Putler too, you can connect multiple data sources. The advantage here is you can see individual stats for each of your business performance as well as combined stats. Putler has an automatic deduping process which removes data duplicates that arises after combining multiple data sources. So you always get accurate data each time.
Currency Conversion
Baremetrics
Whatever currency you use in Stripe, the same is set by default in Baremetrics reports and all other currencies would be converted to that. If you want to view reports in a different currency, you need to contact the Baremetrics support team.
Putler
Putler on the other hand supports multiple currencies. Putler automatically converts currencies to give you a global, single currency dashboard. Be it dollars, euros, pounds, rupees.
Analytics & Reporting
E-commerce analytics & e-commerce reporting is the heart of any business. Most of the data any business needs is available under these categories. These includes dashboards and metrics along with other supporting sales growing tools and insights.
Baremetrics Reporting & Analytics
Dashboards & metrics
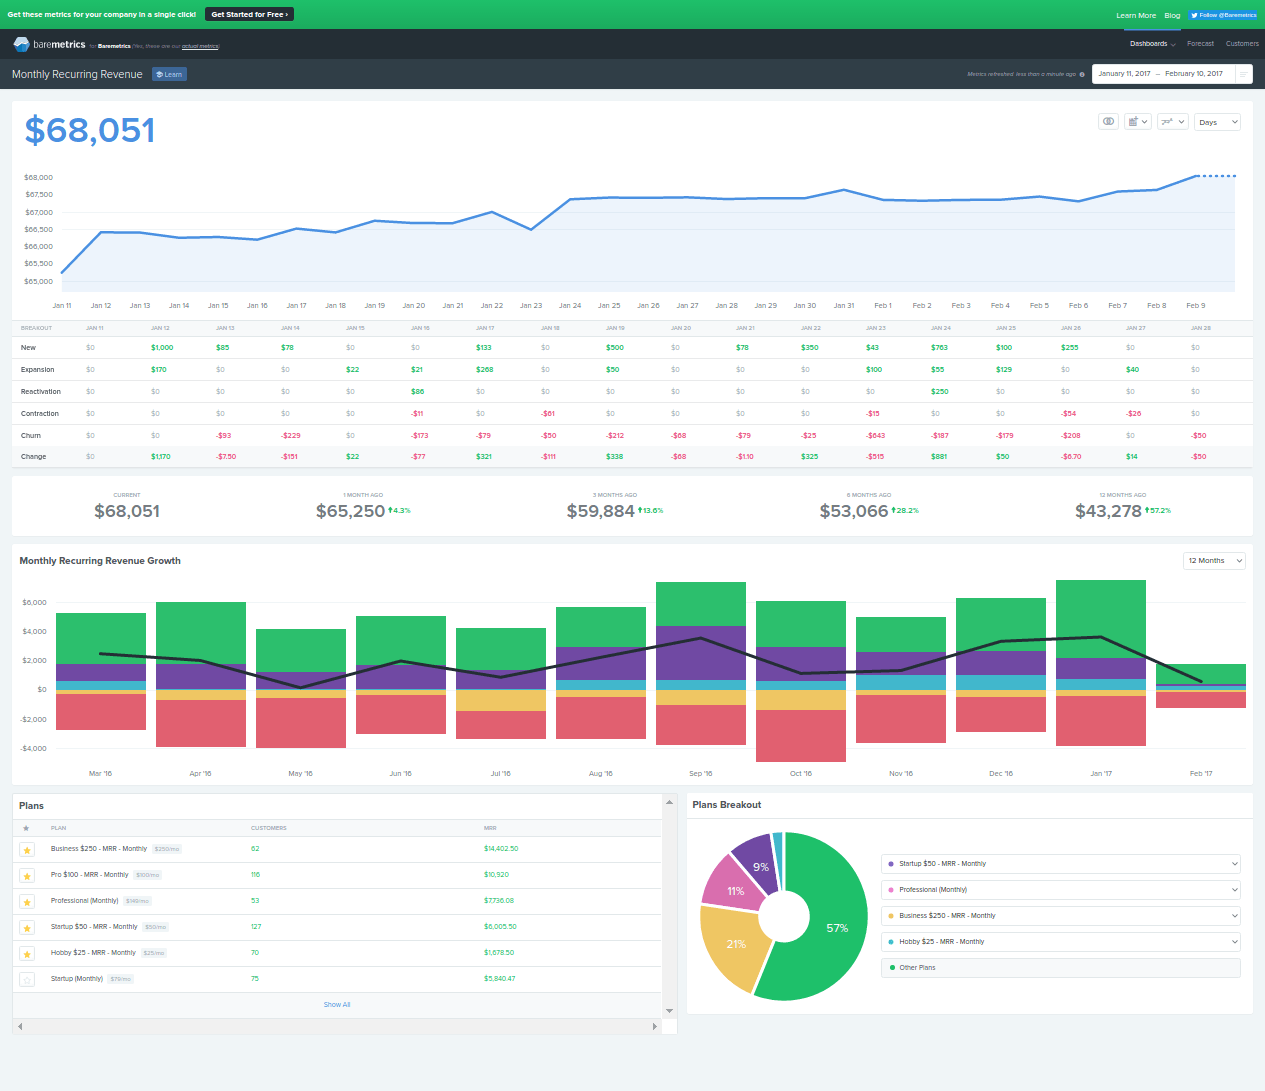
Subscription businesses being the target niche, Baremetrics reports includes a global dashboard providing all important subscriptions metrics. Monthly Recurring Revenue, Annual Run Rate, Refunds….a total of 20 metrics in a single dashboard. Next to the dashboard is the live streaming of recent transactions- upgrades, failed transactions, churned customers, etc.
Along with the global dashboard, there are individual dashboards for each of the 20 metrics highlighting complete details. These dashboards boasts of pretty graphs and all required information. No doubt, Baremetrics has done a good job here.
Forecasts
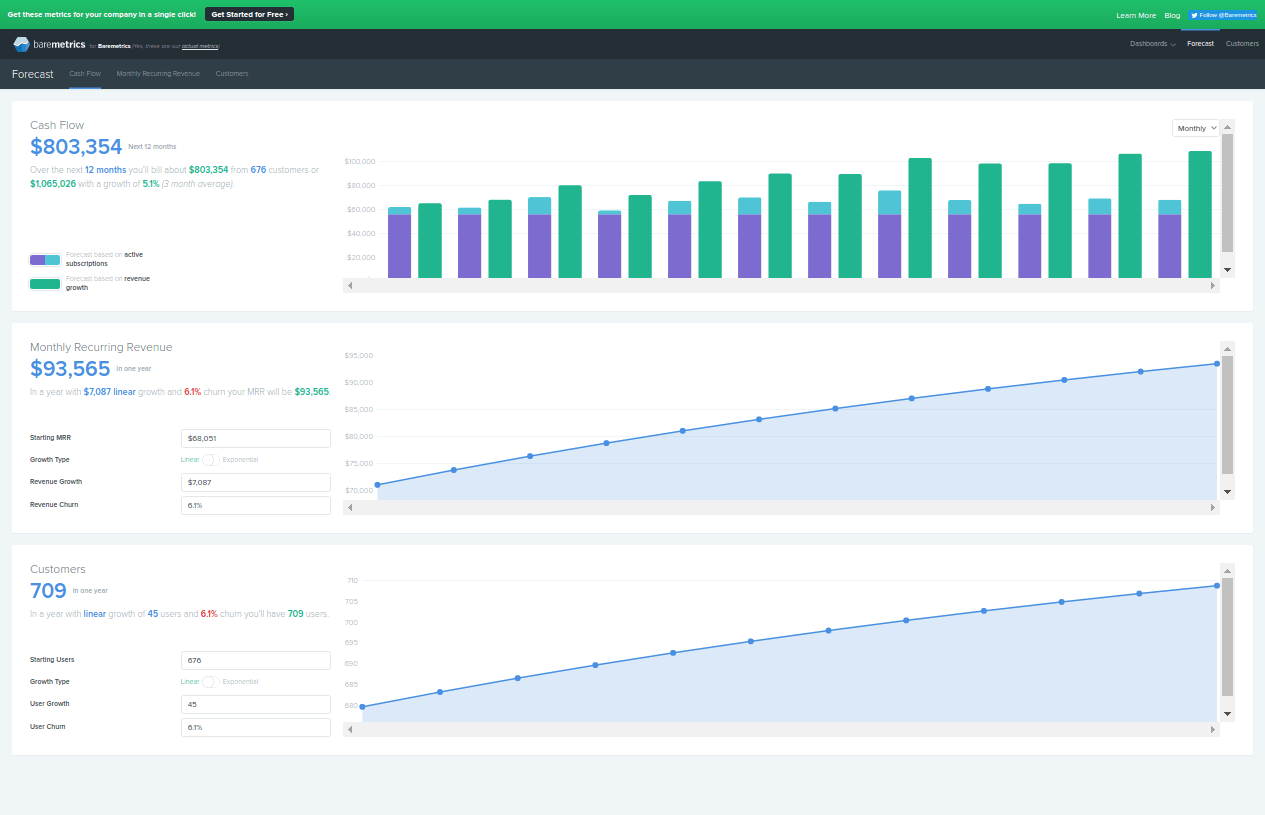
Baremetrics provides forecasts for three categories:
- Cash flow: The total value you will bill to a particular number of customers over the next 12 months
- Monthly Recurring Revenue: Your MRR in one year considering churn rate
- Customers: Number of customers you will acquire
These three forecasts are presented in a graphical form along with some other metrics. Again, pretty simple to understand.
Customer Profiles
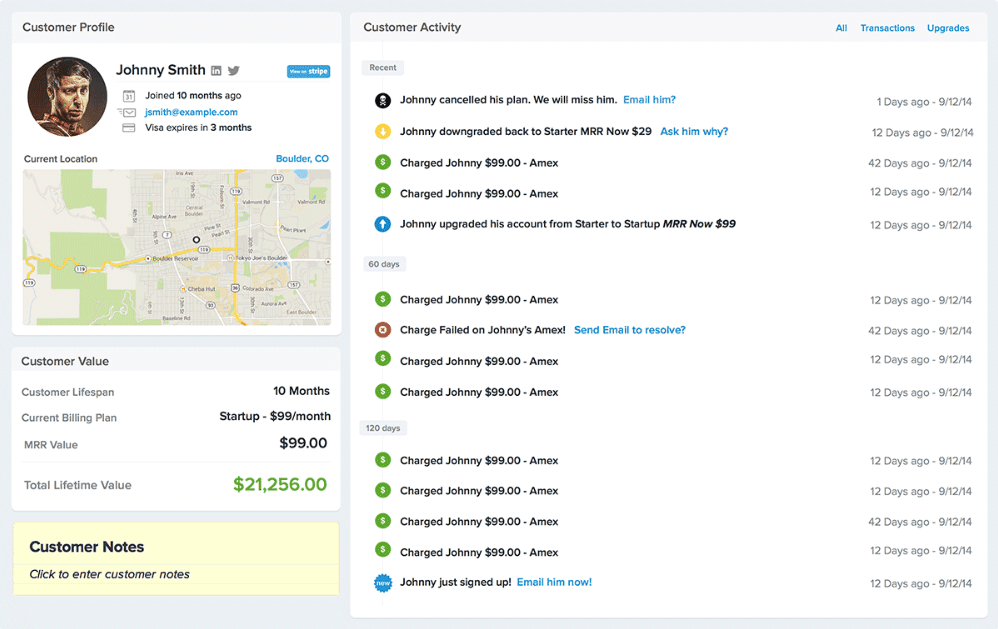
Customer profile means you get all the relevant and complete details of all your customers.
These details include: customer name and address, social media profile links, his credit card expiry date, lifetime value, entire transaction history- upgrades, downgrades, etc.
Email Reports & Notifications
Baremetrics can send daily, weekly & monthly email reports and notifications to you and your team so that you are being updated about your business activities. These reports include data like customer transaction status – whether he downgraded or cancelled his subscription. Or possibly there was a failed payment.
Credit Card Dunning
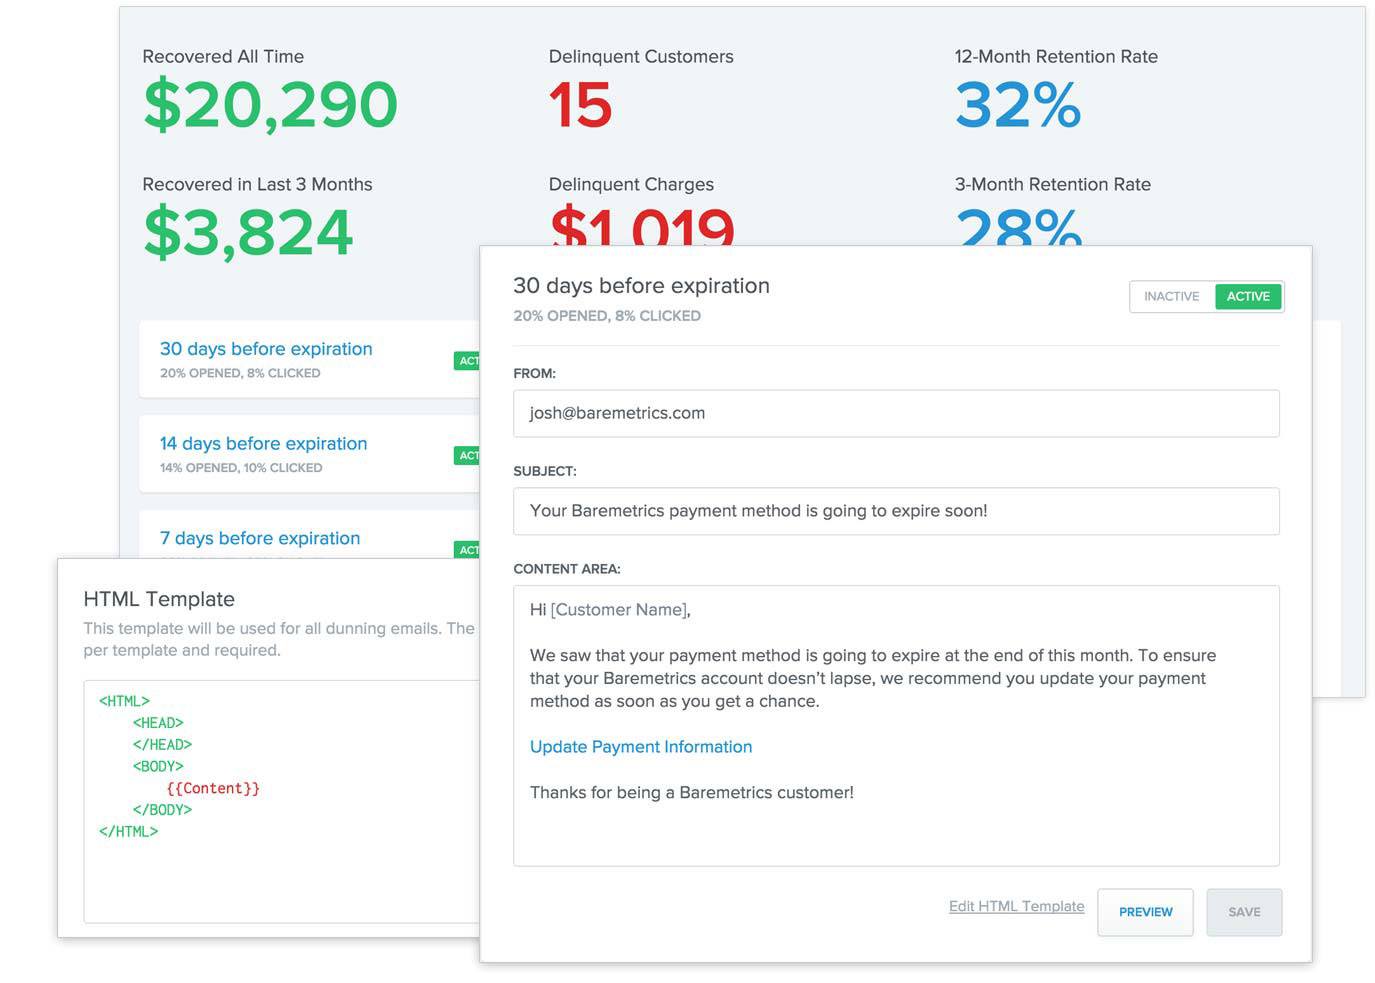
Handling recurring billing and payments is a challenge for SaaS company due to multiple credit card issues such as failed payments, expired credit cards, blocked cards or limit issues.
However, before such problem arises, an email is sent to the customer updating them about their card status so that there is not any transaction failure during upgrades or switch over to plans.
Insights
Baremetrics says: one-click, zero-setup subscription analytics & insights. But these insights are not separate. They are actually the metrics only that are covered in the their dashboards and reporting section.
Putler Reporting & Analytics
Dashboards & Metrics
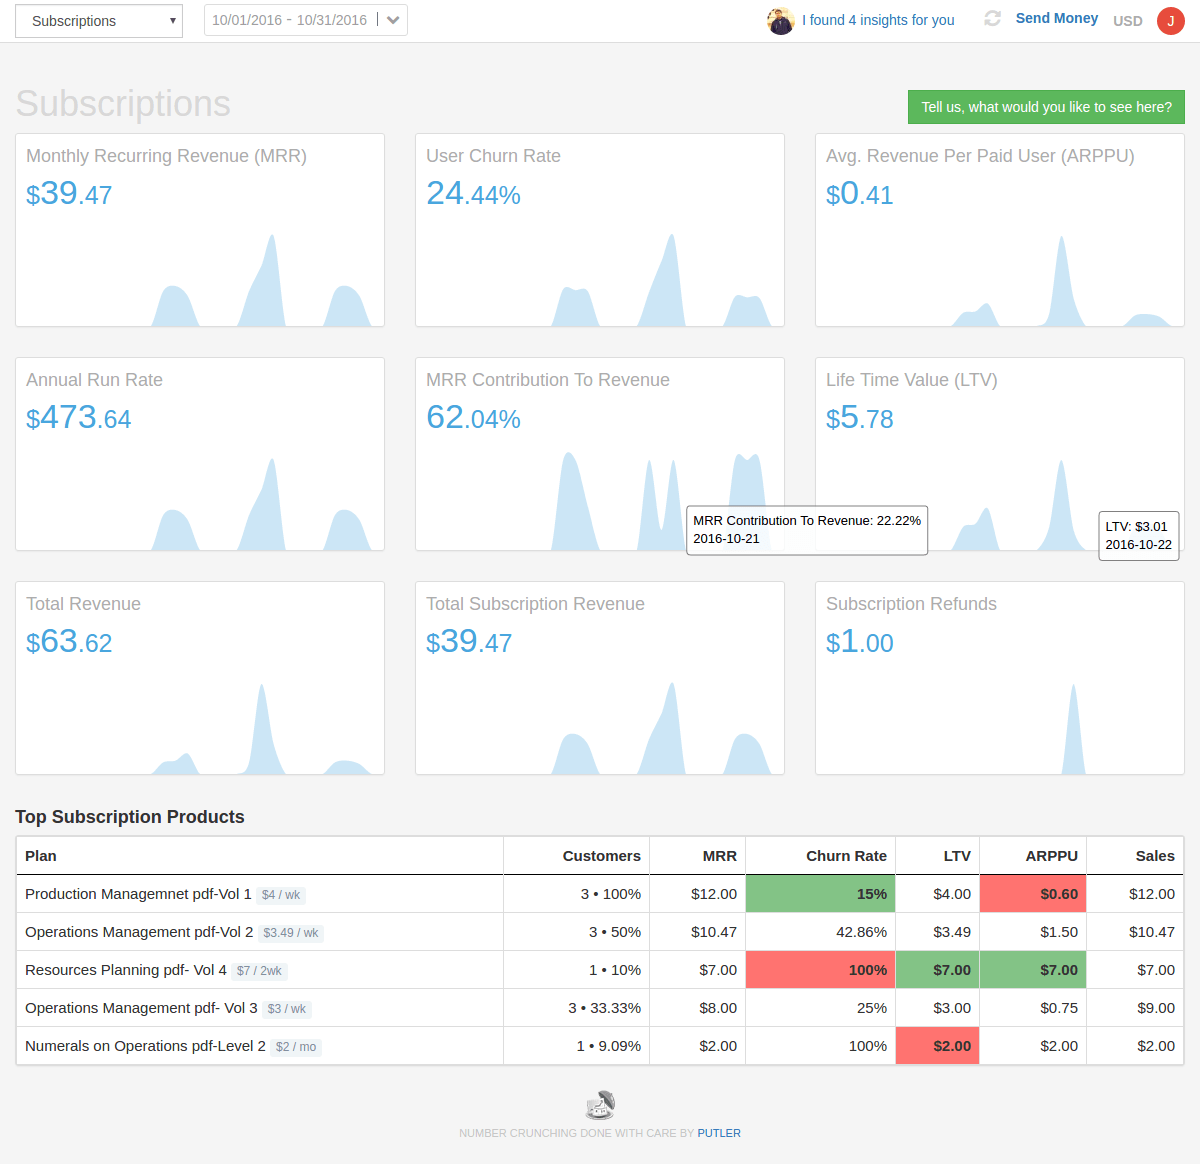
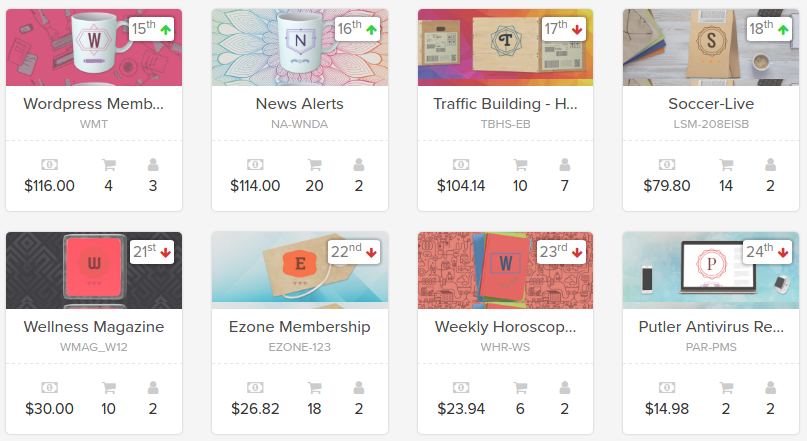
Using Putler, you get an overall business picture as well as individual dashboards that has business analytics as well as website analytics at a single place.
Along with overall business view, Putler provides 6 in-depth dashboards covering 153+ important metrics and KPI’s. These are:
- Sales dashboard: Time-wise sales, refunds, orders, monthly target, best time when maximum sales occurred, etc.
- Subscriptions dashboard: MRR, Churn, ARPU, LTV, etc.
- Transactions dashboard: Fees, taxes, type of payment, etc.
- Products dashboard: Product leaderboard, top 20% products, best and worst sellers, etc.
- Customers dashboard: Name, address, returning customers, etc.
- Visitors / Audience dashboard: Top pages, search terms linking to your website, bounce rate, revenue from different countries, etc.
These dashboards gives you all the much needed data you need for your business to grow.
Select any dashboard, click on a particular element and you will get every bit of it.
Learn more about Putler’s metrics & dashboards.
Google Analytics Integration
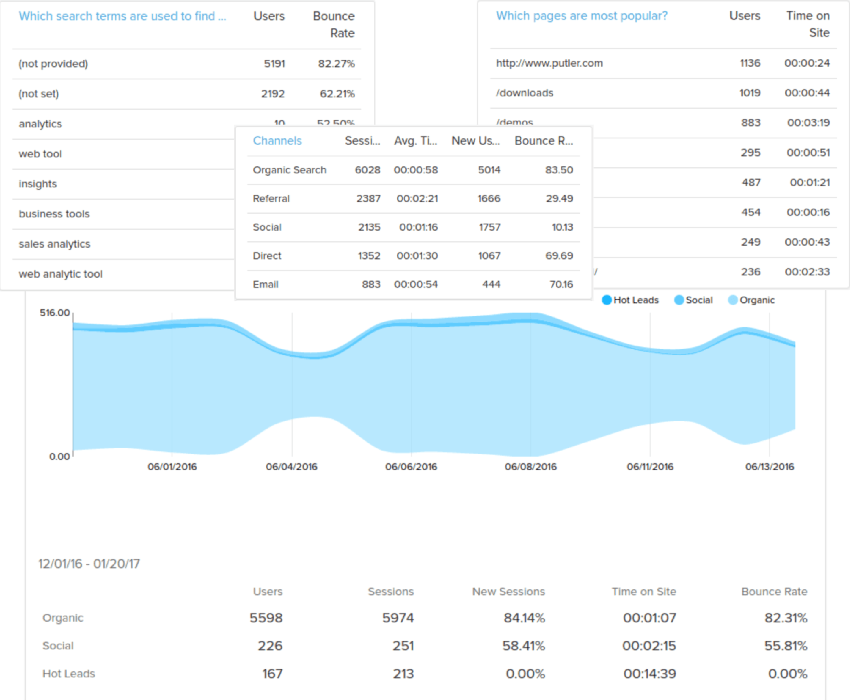
As Putler also has a direct Google Analytics integration in addition to payment gateways and shopping carts, you get a combined reports of e-commerce analytics and website analytics data at one place. Metrics like:
- Top landing pages
- Bounce Rate
- Search terms
- Number of visitors from different countries
and many more..
Just Google Analytics data is too complex to understand and non-tracking of refunds gives you false sales figures. But with Putler, you don’t need to worry of your sales figures or other data. They are always accurate.
Intuitive Search
Looking up for a transaction? In less than 5 seconds, you get the desired search results. Putler’s search works at a blazing speed.
Managing subscriptions & refunds
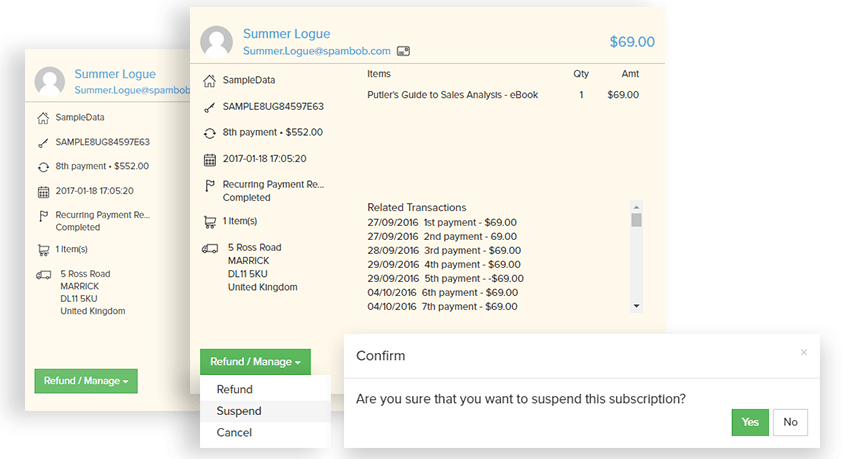
If you are stuck with the lengthy process of managing subscriptions of payment gateways, bid farewell to it. Using Putler, you can easily manage the subscription process without any hassle. Suspend, cancel, reactivate and refund recurring payment subscriptions all done easily.
Also with Putler, you can issue refund directly to customer. Just two clicks and the process is done. You can even select what products to refund, or what % to refund.
Send Money
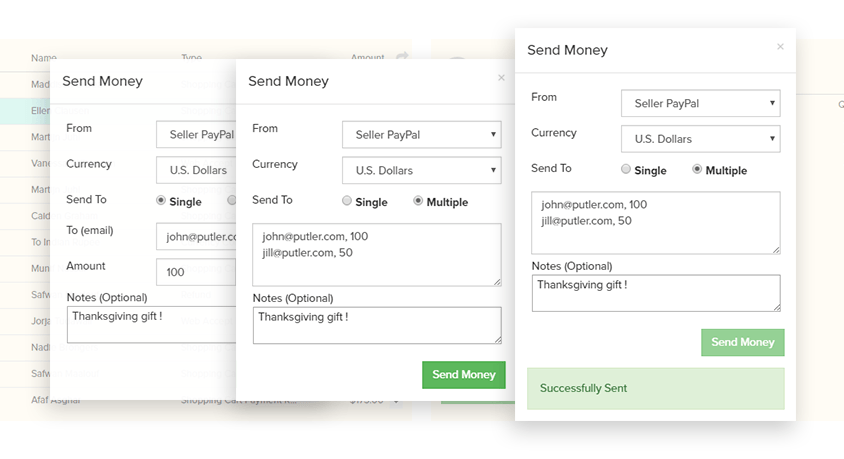
Sending credits or discount to customers, or transferring money to the needy person in any part of the world. You can easily send money to them that too in your preferred currency. Only thing required by both the sender and receiver is a PayPal account.
RFM (Recency Frequency Monetary) Analysis
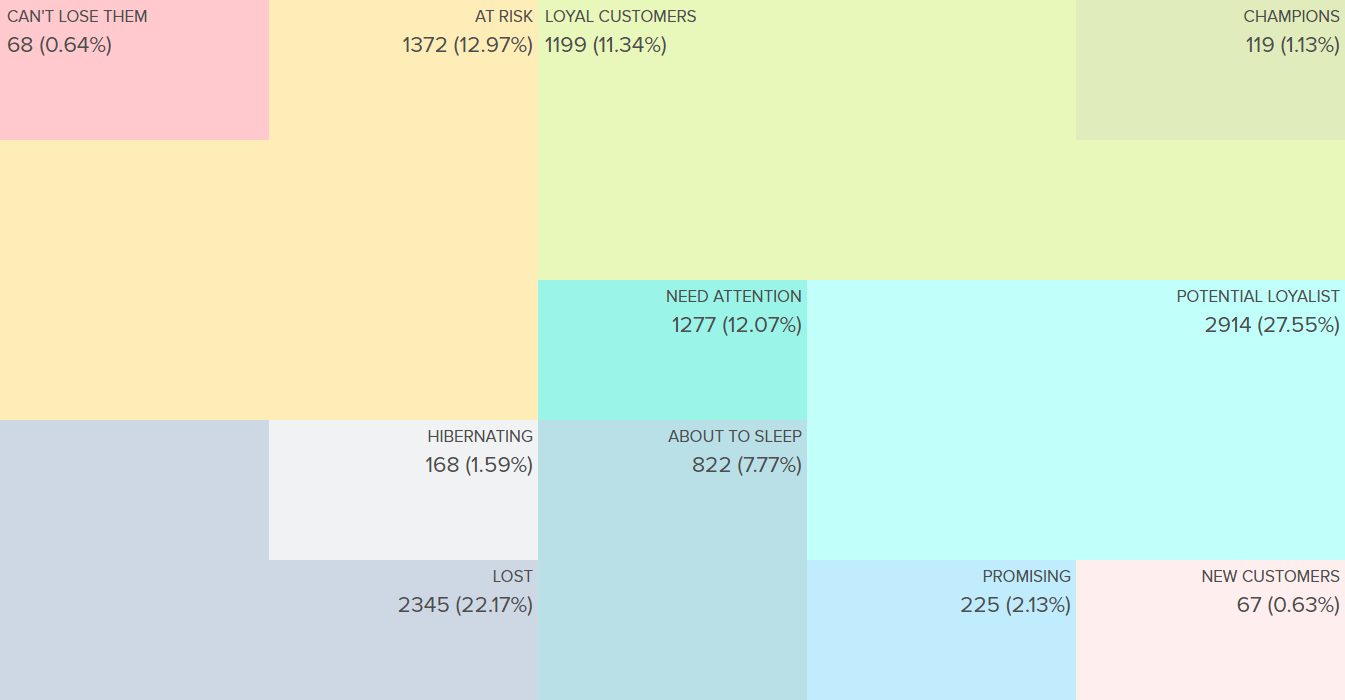
Customer’s are the lifeline of business and which customers turn out to be the most profitable ones needs special attention. These customers can be found out by a unique technique called as RFM. It’s the best way to understand your different customer segments.
After complete analysis, 11 different customer segments are created- the best customers, loyal customers, customers on the verge of churn, lost customers, etc.
Easily understand your potential customers and send relevant marketing emails to retain them.
For example- The Champions Segment has 119 customers. These set of customers are your best and most profitable ones. They make purchases frequently, spend very good amount and they recently made a purchase.
Customer Profiles
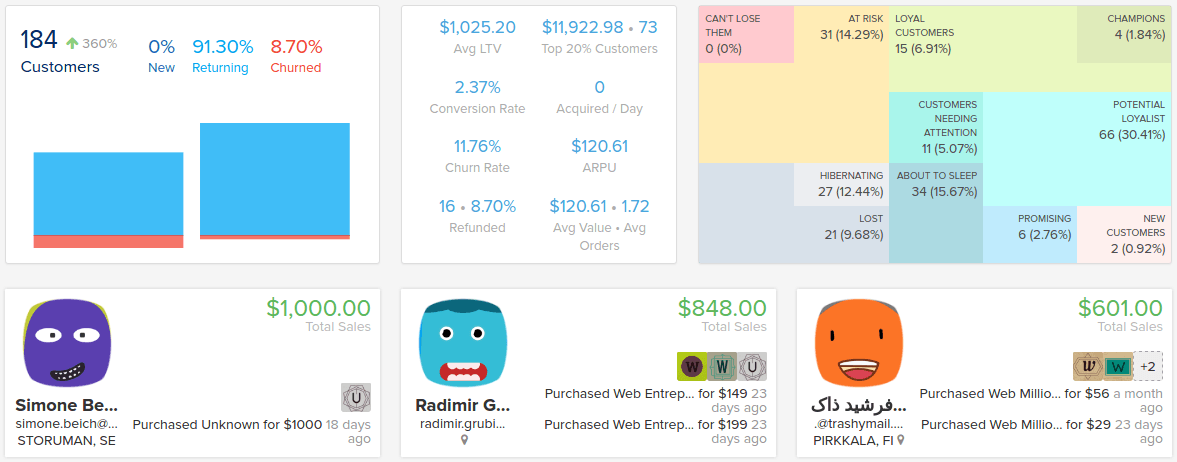
In Putler, customer dashboard fetches you all the customer details you click on- name, address, transaction details, etc.
It also includes the RFM analysis. A little more details are to be added to make customer profiles look more appealing and handy. These feature will be rolled out very very soon.
Putler Insights: Going Beyond Number
Putler gives not only the metrics covered in the dashboards. But also actionable insights / growth tips that are completely unique and developed by deeply analyzing your business. Here’s an example below:
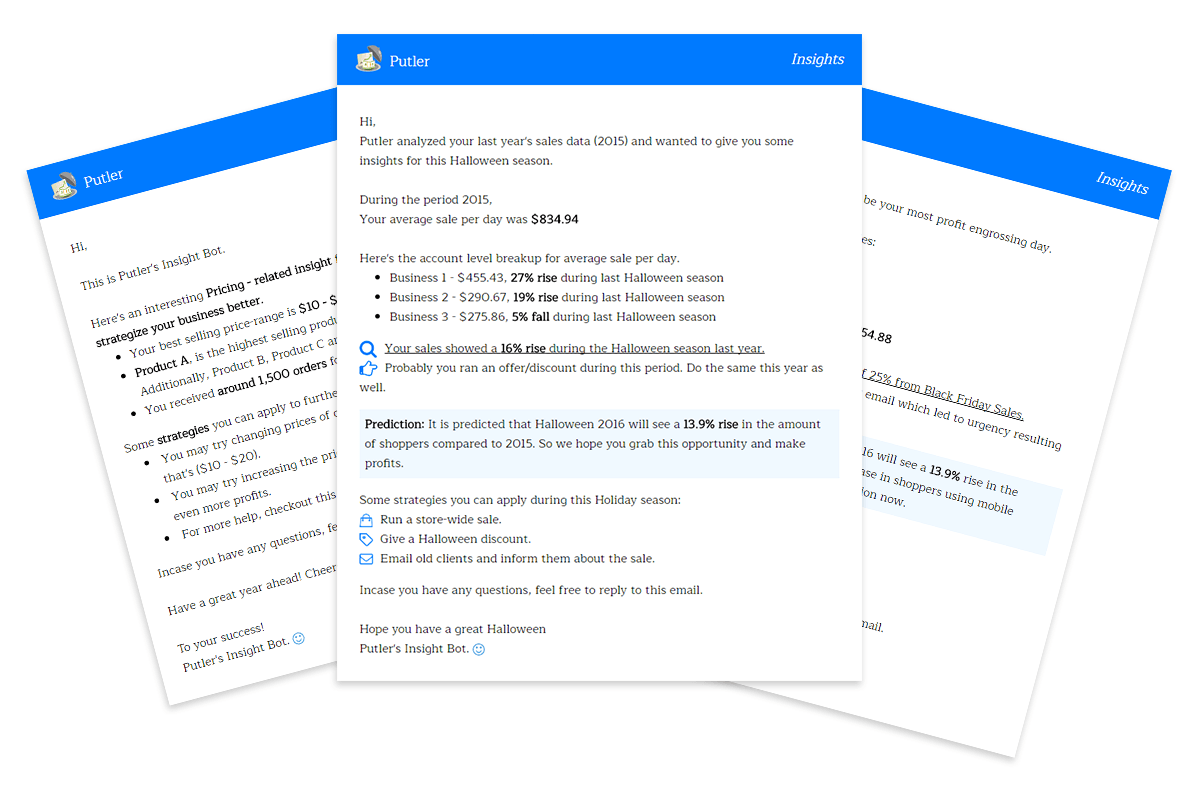
This involves a deep number crunching of your data, analysing it and then generating results. Along with insights & metrics, you also get some practical advises by top business personalities from across the globe.
Baremetrics Pricing
Baremetrics offers 4 pricing plans based on your Monthly Recurring Revenue (MRR):
- Startup: $50/month ($10,000 MRR or less)
- Professional: $100/month ($50,000 MRR or less)
- Business: $250/month ($200,000 MRR or less)
- Enterprise: $500/month ($500,000 MRR or less)
Additionally, you need to pay extra bucks starting at $25/month based on your MRR for failed payment recovery system on top of your main plan. With increasing MRR, the recovery system price increases too.
Customer profiles and cohorts is available in all three plans except the startup plan. The startup plan only has basic features.
It offers a free trial for two weeks.
Know more about Baremetrics pricing
Putler Pricing
Putler offers 3 pricing plans with no differentiation based on your revenue or number of customers nor size of your business. The pricing varies as per number of ecommerce system, payment gateways & Google Analytics accounts you can integrate:
- Plus: $25/month (Upto 3 integrations)
- Pro: $75/month (Upto 7 integrations)
- Max: $250/month (Upto 20 integrations)
It offers a free trial version for 14 days. After that, you can select / upgrade to the plans as per your requirements.
Know more about Putler pricing
Baremetrics vs Putler Comparison Table (Overall)
| Features | Baremetrics | Putler |
|---|---|---|
| Business Niche | Subscription businesses | All online businesses including subscriptions |
| Direct Integrations | Stripe, Braintree, Recurly, Chargify | PayPal, Stripe, Braintree, WooCommerce, Shopify, Magento, Etsy, Google Analytics..15+ direct integrations |
| Other Integrations | Use Baremetrics API | Use Putler API |
| Multiple Currency Support | Contact Baremetrics team | Direct |
| Consolidation | Yes. But can’t see individual stats | Yes. Can see individual stats as well as combined |
| Dashboards & Metrics | One main dashboard consisting of 20 metrics + 20 dashboards for each of the above metric + live transactions dashboard | One main dashboard- ecommerce & visitors combined. 6 additional dashboards consisting of 153+ metrics |
| Intuitive Search | No | Yes |
| Credit Card Dunning | Yes | No |
| Subscription Management & Refunds | No | Yes |
| Send Money | No | Yes |
| RFM | No | Yes |
| Email Reports & Notifications | Yes | Yes |
| Customer Profiles | Yes | Yes |
| Forecasts | Yes | Yes |
| Cohorts | Yes | Coming soon |
| Insights | Metrics | Metrics + Analyzed growth hacks + Expert advices |
I know Baremetrics features are impressive and so is Putler’s. So I recommend you to try their demos for more clarity.
Conclusion – Which Is Better?
If you are only into subscriptions business, have more interest in deep details of subscription metrics, forecasts, and don’t mind spending more money every month, you can opt for Baremetrics.
If you are into any online business, require multiple platforms support, need all business metrics, multiple dashboards, easy subscriptions management, deep insights all at one place, that too at an affordable price, you must use Putler.
Comments.. Feedback..Suggestions?
This was our take on both these business softwares. Both are excellent in their respective niches.
Have you used Putler? Did you find it as a better Baremetrics competitor?
Or you have used Baremetrics and found it better?
Let us know your suggestions and ideas on the same.
Disclaimer: We have tried to be as unbiased as possible. All content has been taken from the respective websites. The content may change over time.
How does Putler compare with other analytical tools
| Features | Putler | ChartMogul | Baremetrics | Metorik |
|---|---|---|---|---|
| SaaS Metrics | Yes | Yes | Yes | Yes |
| Non SaaS Metrics | Yes | Yes | No | Yes |
| Website metrics | Yes | No | No | Yes |
| Number of Integrations | 17 | 7 | 4 | 4 |
| Integrates with PayPal | Yes | Yes | No | Yes |
| Team sharing available | Yes | No | No | No |
| Realtime updates | Yes | Yes | No | Yes |
| Multi-currency support | Yes | Yes | No | Yes |
| Aggregated reports | Yes | No | No | No |
| Individual reports | Yes | No | No | Yes |
| Customer Segmentation (RFM) | Yes | No | No | No |
| Send money functionality | Yes | No | No | No |
| Subscription Management | Yes | No | No | No |
| Process refunds | Yes | No | No | No |
| Desktop App | Yes | No | No | No |
| Chrome extension | yes | No | No | No |
| Intuitive Search | Yes | No | No | No |
| Pricing | $29 | $100 | $50 | $50 |
