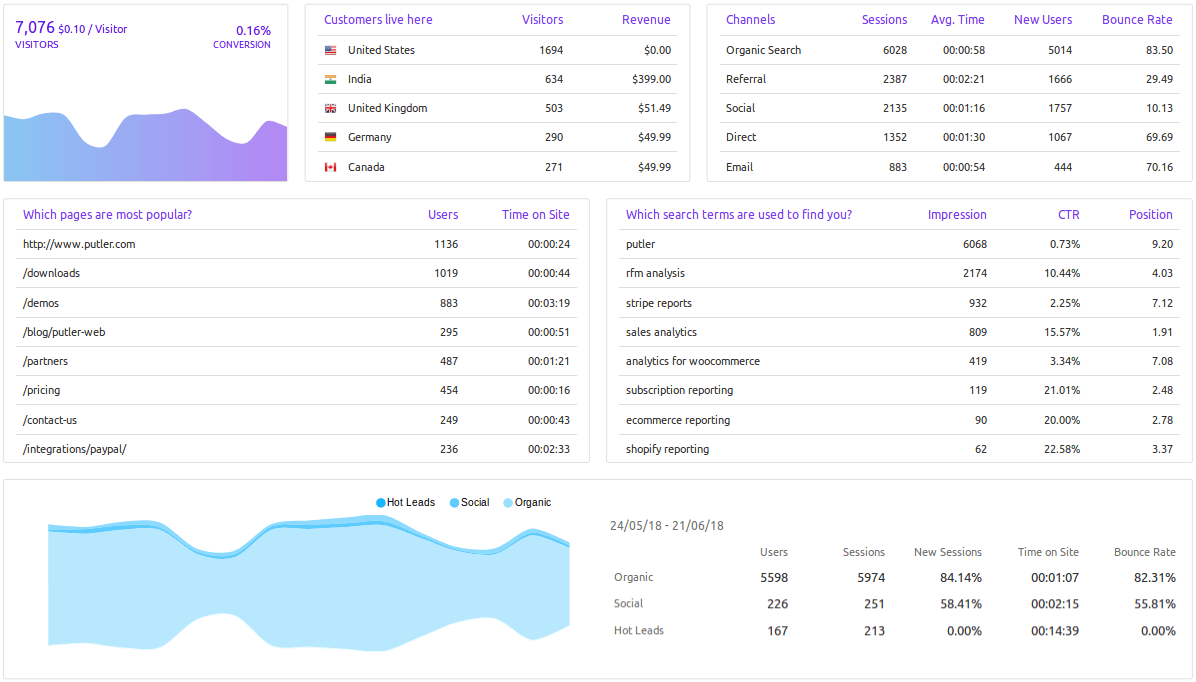
Putler pulls in data from both Google Analytics, Google Console and provides all the important visitor engagement metrics in a single dashboard. Using Putler, you can connect multiple Google Analytics accounts to one place.
NOTE: Since Putler can also integrate with your payment gateway, shopping platform, Putler intuitively correlates visitor data with revenue data and provides you accurate reports that help you take critical decisions.

Visitors
The total number of visitors to your website for the selected date range.
Sales / Visitor
The total sales made in the selected date range divided by the total number of visitors to your website in that same date range.
% Conversion
The total number of customers for the selected date range divided by the total number of visitors to your website for the same date range.
Which pages are most popular
Your top website pages that get maximum traffic for the selected date range.
Which search terms are used to find you
List of keywords that brings users to your website for the selected date range.
Impression
The number of times a particular keyword was seen by users in the search results for the selected date range.
CTR
The number of clicks divided by the total number of impressions for a particular keyword for the selected date range.
Position
The average position of the keyword in the search results for the selected date range.
Example – If the position for keyword ‘sales analytics’ is 9.2, that means your page or post containing the keyword ‘sales analytics’ will be most probably at position 9 or 10 in Google search results.
Want these metrics for your business?
Also check out: Customer Metrics, Products Metrics, Sales Metrics, Transactions Metrics, Subscriptions Metrics, Time Machine Metrics, Insights, Home Metrics
