Sales are important for every business. And in order to keep your business afloat, you need to meticulously track sales metrics day in day out. Literally.
So business owners often face dilemmas like – what’s the best sales analytics tool? Which sales metrics should you monitor?
In this article, I will show you what makes Putler an all-in-one sales analytics tool. I will break down each and every sales metric that Putler provides and give you examples of how you can use them in your business).
Continue reading…
Sales Dashboard
Quickest way to dig in to your sales data and take smart decisions
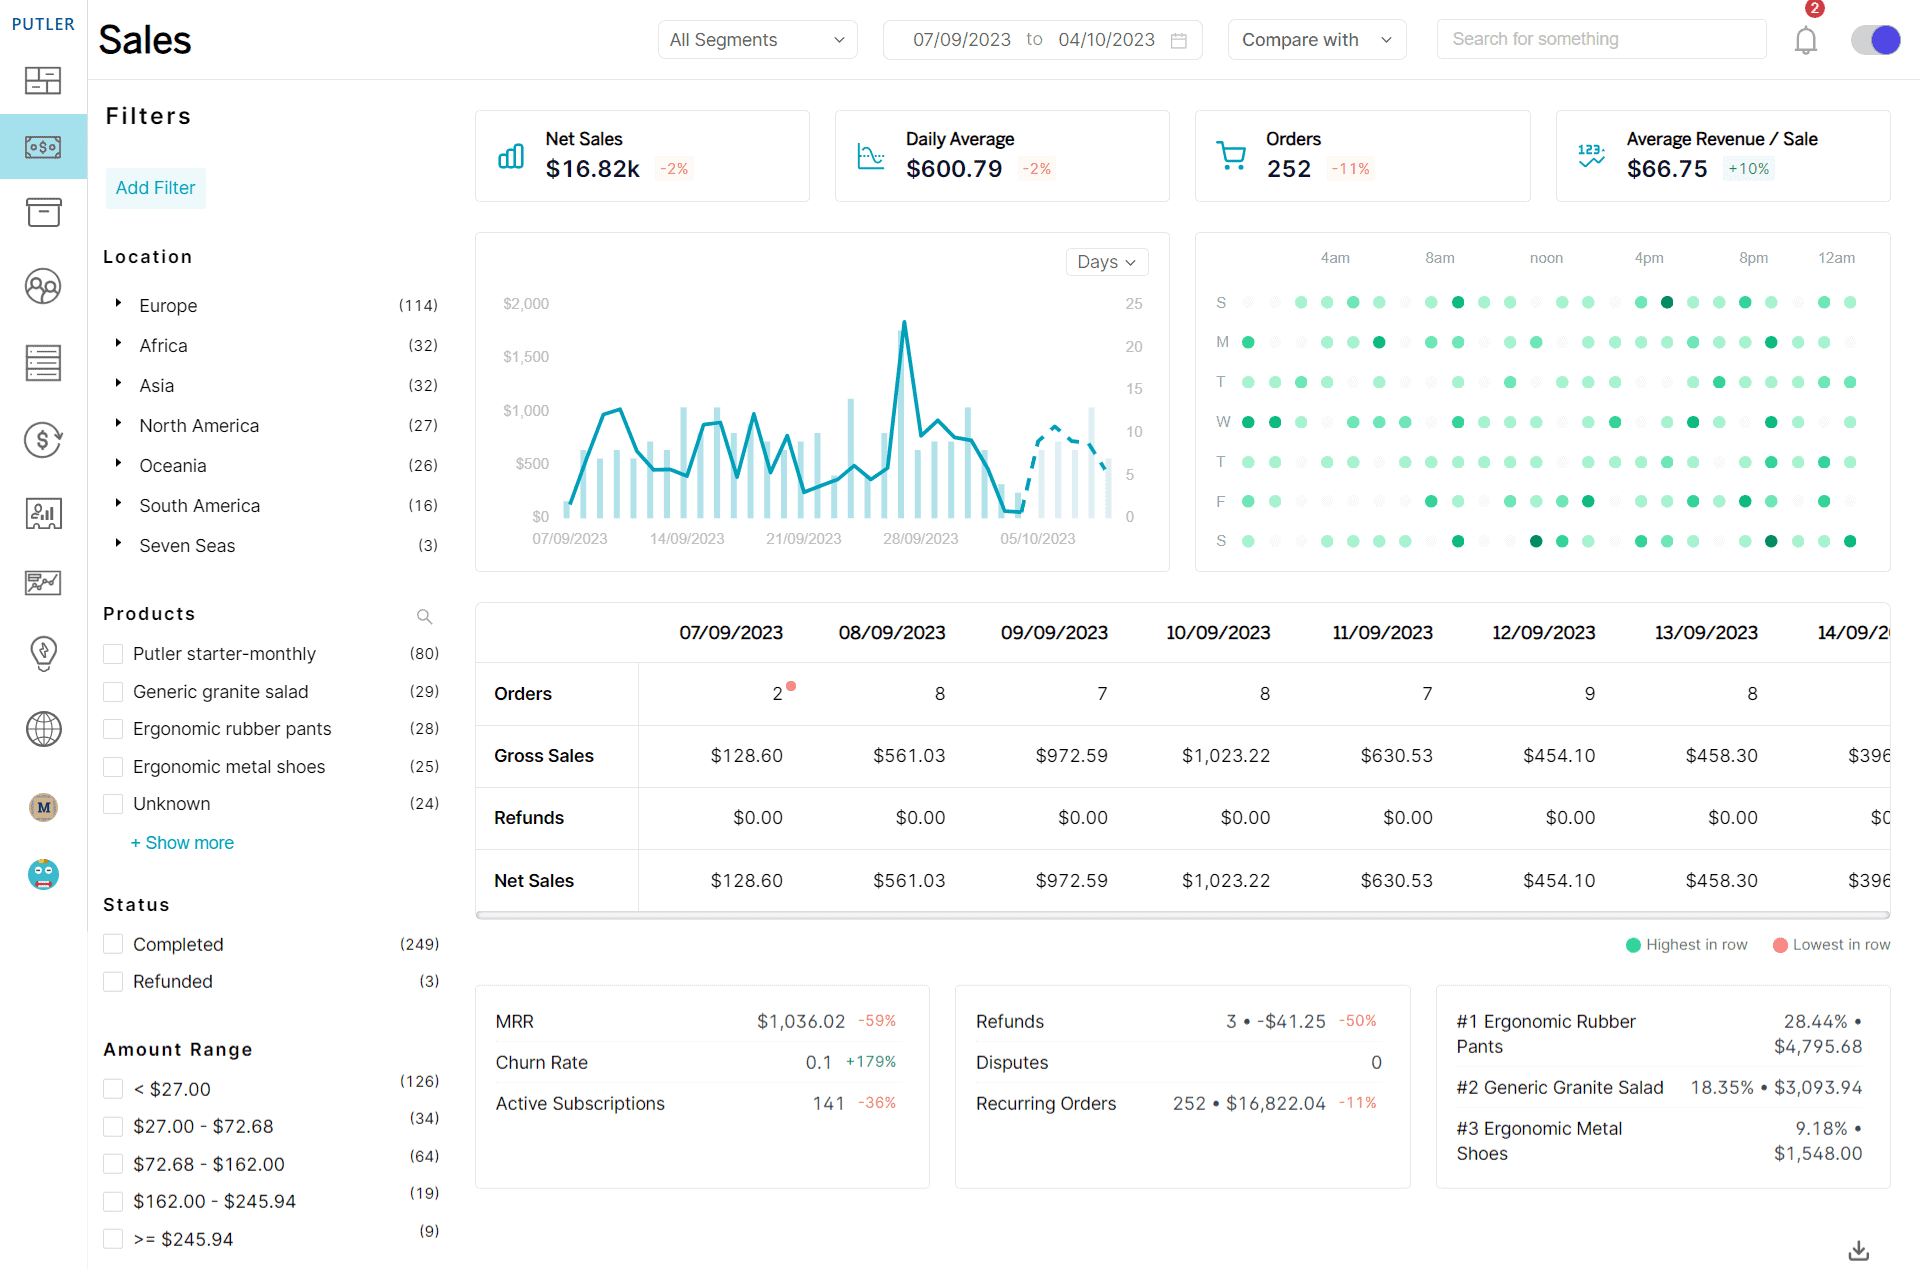
Aggregated sales data, that gives you the whole picture. Putler seamlessly pulls in data from multiple sources, without causing you stress.
Facets
Use pre-defined filters to narrow down data and get interesting insights.
Instant Search
Scan through billions of records and get results within seconds.
Sales Heatmap
A visual map showing when your customers are most active.
Segments
Easily filter complex data and create powerful segments for marketing purposes.
In-depth Reports
Get a broader picture of your customer data.
Sales Breakdown Chart
Transforms complex sales data into a clear, actionable visual snapshot.
FACETS
Facets are nothing but pre-made filters that help you narrow down data.
You can filter data based on various parameters and have a deeper understanding of your data, customers, sales and business as a whole.
Wondering how to use facets? Don’t worry I’ve got you covered…
- Filter By Country
- Filter By Products
- Filter By Order Status
- Filter By Amount
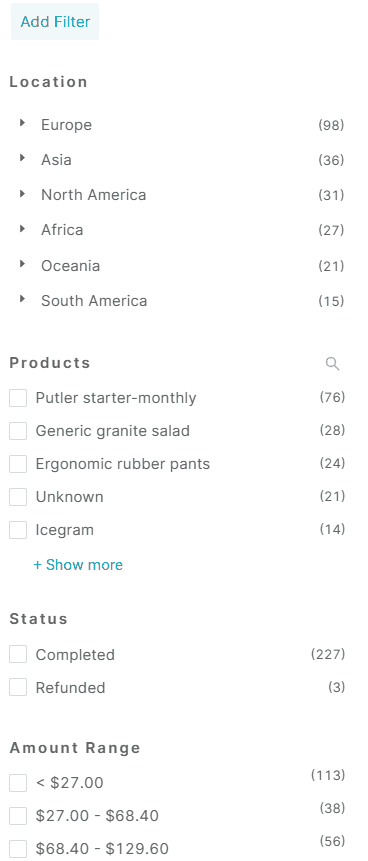
Here are ways you can use facets to make better business decisions
Filter by Country
Filtering by country was the most requested feature in Putler so we have it delivered. Using this facet you can easily see which are your top revenue-generating countries.
Once clicked on the country you can see who are the customers who actually belong to this country and who have bought your products.
Insight-wise, this data is critical. How?
It’s simple!
Once you get to know which country provides you with the most revenue you can make important decisions like;
- Should I translate my app to the local language of this country or not?
- Should I hire a bilingual copywriter and draft the sales page specifically for this country or not? (Of course, Google does a good job at translating but more focused content might get you more sales)
- Should I run Facebook ads or other marketing campaigns for this specific region?
- Should I have a live chat in this country’s time zone?
- What’s the main festival of this country and should I run a sale for it?
Well, the decisions are endless. These are some starting points you can initiate with.
Filter by Products
After countries, filtering by-products is the next thing. I’m sure as a person who cares about your business, you worry about the welfare of your products. And there is nothing more than viewing important details of each product with a click, right?
Putler’s Product Filter Facet is that single click. It shows you all your top products and once clicked it gives you all the information about that product.
Looking at this data, you can figure out:
- Sales contribution by a single product.
- Customers who have bought a product and if they are a candidate to buy something else complementary to this product.
- Which countries did these customers belong to?
Filter by Order Status
As a business owner, you need to be aware of what is happening within your business. Especially where payment is concerned. This facet totally focuses on that and gives you a total view of the order status as well as who are the people who fall under that status.
Putler provides you with FIVE order statuses:
- Refunded
- Pending
- Completed
- Failed
- Partial refunds
Filter by Amount
You can use this facet to find the spenders above a certain threshold. Taking a look at this will give you some idea about the financial spending of your customers and help you devise marketing campaigns or giveaway special freebies to customers.
Explore ways to use these filters
Instant Search
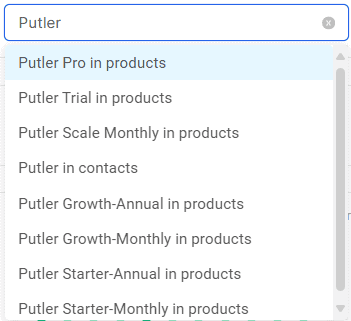
In the Sales dashboard, you can search for customer name, product name, customer email ID, and transactions within seconds.
Segments
RFM segmentation is king but creating custom segments is a whole new level of data analysis. And you guessed it right, we built it!
“Instead of getting overwhelmed with data, metrics and reports, if a store owner can focus on like-minded groups of customers and create unique opportunities for each of them, they can see a rapid return on their investment.” – Chris Lema
Create Segments
In the new Putler Sales Dashboard, you can easily create custom segments by defining rules/ groups of rules.
You can drill down data by country, customer name, products etc. Infact, not just drill down on single parameters but create groups of rules and drill data according to that.
For example:
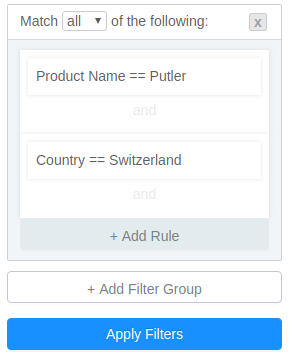
Suppose you want to find the customers who have bought a particular product say Putler from a particular country say Switzerland you can find that.
Rules would look like:
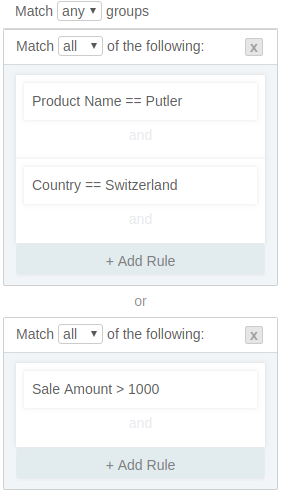
Now if you want to add another level of drilling and find both people who bought Putler from Switzerland OR people who have spent above $1000 from any country.
Here’s how you would do it:
Putler will give you the exact result that satisfies these rules.
Well, this was just an example, I’m sure you will have tons of drill-down use cases for your business.
Do try it out and do share. I will be glad to learn a hack or two.
Save Segments
Putler allows you to create segments across the dashboards. Also once you create a segment it also allows you to save it for later use.
Saving segments not only saves you time but it also helps reuse them with zero effort again.
One example of Saving a segmentation Putler is as follows:
Suppose you want to find who has bought an iPhone from America in order to target them with an iPhone cover.
Firstly you will create a segment where,
Country == United States AND Product Name == iPhone
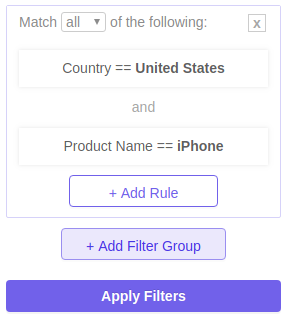
You will get the customers in the US who have bought an iPhone from your store. You can then use this information to offer only this segment an iPhone cover.
Well, this was just one example, using Putler Beta, you can create multiple segments having various filters and save them. You can then use these segments for carrying out targeted marketing.
Detailed Sales Reports
Putler’s Sales dashboard lets you search, filter data, and show the results in the form of a grid/list. But what if you want to see in-depth reports of each of these records?
Putler’s detailed sales reports do exactly that.
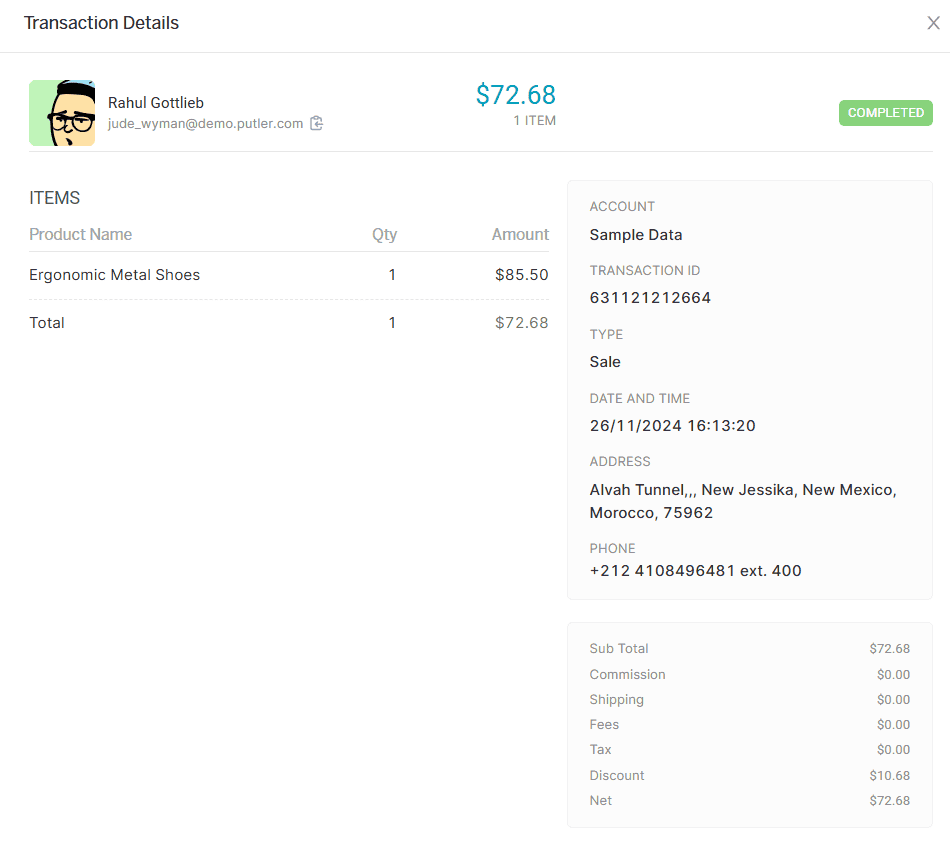
It gives you a complete invoice-like view of the sale made – Customer details, Order details, Transaction ID, Order status, etc.
Check out other in-depth reports in Putler:
- Customer reports
- Product reports (Coming Soon)
Sales Heatmap
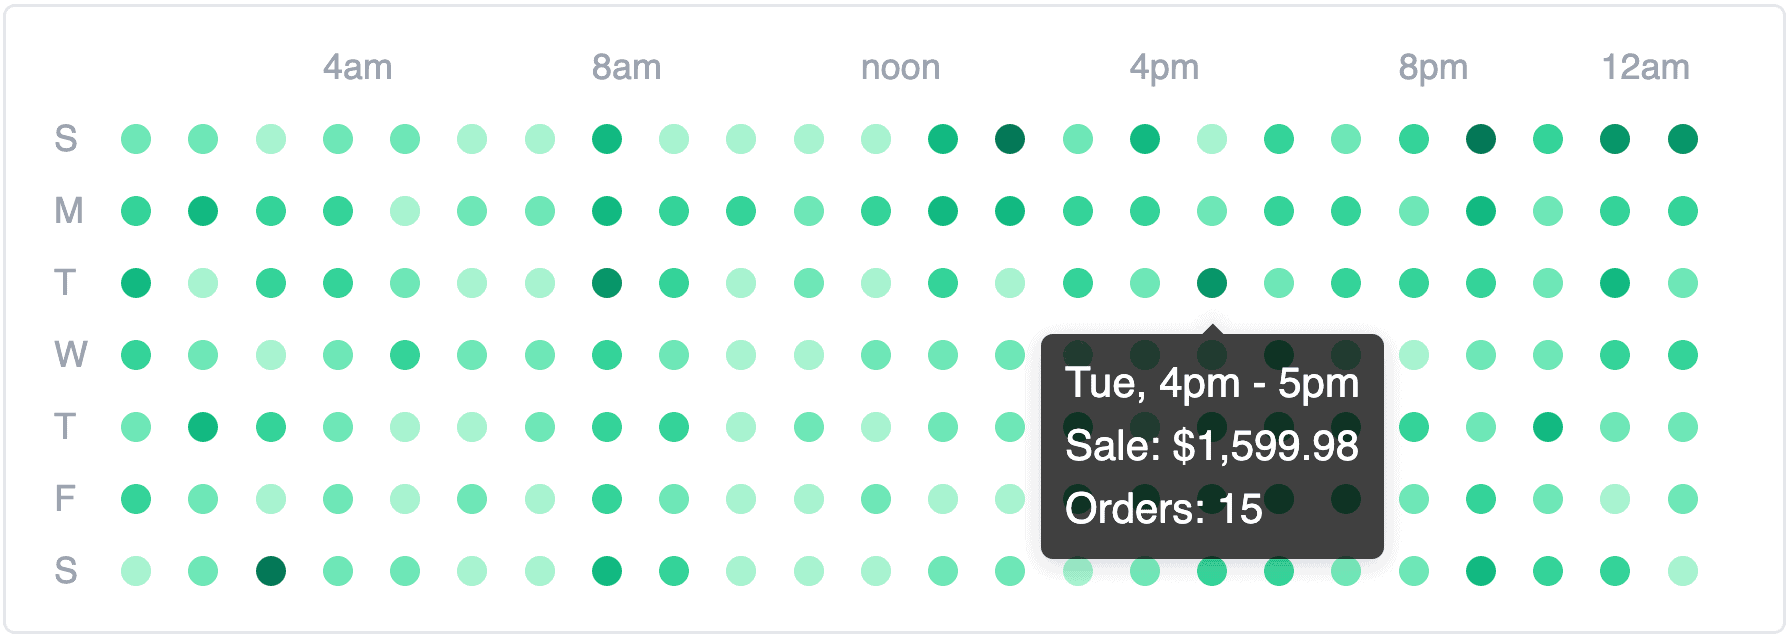
Have you ever wondered when your business performs at its best?
Putler’s Sales Heatmap helps you see when customers are most likely to make a purchase.
By transforming your sales data into an easy-to-read visual map, you’ll instantly see your peak performance times. Imagine knowing precisely when to run promotions, schedule marketing campaigns, or adjust your business operations.
No more guesswork – just clear, actionable insights that help you make smarter decisions and maximize your revenue potential.
Sales Breakdown Chart

Think of the Sales Breakdown Chart as your business’s financial snapshot – simple, powerful, and packed with strategic insights.
By selecting specific date ranges, you’ll uncover insights about your orders, gross sales, refunds, and net income that were previously hidden in spreadsheet chaos.
Conclusion
By breaking down complex sales data into actionable insights, we’ve created a dashboard that turns numbers into opportunities.
That’s not all, Putler is just getting started. Imagine taking these powerful features and combining them with future sales trend forecasting – that’s when things get really exciting.
We’ve designed every feature to give you total visibility into your business performance. No more guesswork, just pure, intelligent insights.

