Choosing the right data analytics tool is crucial for business success, but the vast number of options can be overwhelming.
With over 183 million search results for the “data analytics tools,” making an informed decision is challenging.
This guide will help you navigate the selection process by:
- Exploring various data analytics tools.
- Examining key features to consider.
- Providing expert tips for decision-making.
By the end of this article, you’ll be equipped to select a data analytics tool that best suits your business needs.
What are data analytics tools?
Data analytics tools gather large amounts of raw data from various sources or touchpoints and analyze it to uncover patterns, trends, and correlations. They then transform that information into an easy-to-interpret format.
Data analytics tools help businesses make informed decisions by identifying valuable insights hidden in the data. This allows for better strategy development, improved performance, and more accurate predictions.
Let’s take an example of an eCommerce company.
Process:
- Collect data: Product views, cart additions, purchases, etc.
- Analyze data: Identify trends in product popularity and cart abandonment.
- Apply insights: Improve marketing strategies, optimize product recommendations, and enhance the shopping experience
Results:
- Higher sales
- Increased customer satisfaction
Now let’s jump into how to choose the right data analytics tools.
How to choose the right data analytics tools?
Here’s a step-by-step process to choose the right data analytics tools, along with key parameters to consider at each stage:
1. Define your business objectives
Parameter: Identify the specific questions you want to answer with data analytics (e.g., customer behavior, sales forecasting, Product performance, marketing efficiency).
Example: A retail business wants to understand customer buying patterns to improve inventory management.
2. Understand your data sources
Parameter: Know where your data is coming from, such as websites, search engines, Paid ads, or social media.
Example: Best marketing agency seeks to pinpoint the highest traffic sources to target their efforts more effectively.
3. Assess the volume and type of data
Parameter: Evaluate how much data you have and its complexity, whether it’s structured (like sales records) or unstructured (like customer reviews).
Example: A growing online business handles increasing volumes of transactional data and customer interactions.
4. Evaluate tool features
Parameter: Look for features such as data visualization, reporting, AI-powered insights, and real-time analysis.
Example: A subscription-based service needs real-time analysis features to monitor user engagement and adjust content offerings promptly.
5. Check integration capabilities
Parameter: Ensure the tool can integrate smoothly with your existing systems like Multiple stores, Payment gateways, or marketing software.
Example: An online clothing store needs a tool that integrates with its inventory management system, payment gateways, and marketing software to ensure smooth data synchronization.
6. Consider ease of use
Parameter: Choose a tool that matches the skill level of your team, whether they are data experts or beginners.
Example: A small business with a non-technical team needs a user-friendly tool with intuitive dashboards and easy setup.
7. Focus on scalability
Parameter: Ensure the tool can grow with your business, handling increasing data volumes and complexity.
Example: A growing eCommerce business needs a tool that can scale up as its product catalog and customer base expand.
8. Review security and compliance
Parameter: Make sure the tool offers strong security features, including data encryption and compliance with regulations like GDPR.
Example: An international e-commerce business requires a tool that ensures customer data is secure and meets regional compliance standards.
9. Analyze pricing structure
Parameter: Check whether the tool fits within your budget, and evaluate pricing models (subscription, one-time fee, or pay-per-use).
Example: A startup is looking for an affordable tool with a flexible pricing model that can grow as the company scales.
10. Test customer support and training
Parameter: Consider the availability of technical support, user training, and onboarding processes.
Example: A large corporation requires 24/7 support for its team to effectively use the data analytics tool.
By following these steps and assessing these parameters, you can select the right data analytics tool that aligns with your business needs and drives better decision-making.
Importance of having a data analysis tool for your business
Here’s why having data analysis tools is crucial for your business:
- Boost your business: Data analytics helps you make smarter decisions, leading to faster growth and better product choices for your store.
- Stay ahead of the competition: By understanding market trends and customer behavior, data analytics gives you the insights needed to outshine your competitors.
- Improve your strategies: Data analytics helps you fine-tune your marketing, streamline operations, and improve product offerings based on what customers really want.
- Find new opportunities: It helps you spot trends and new opportunities, so you can innovate and expand your store effectively.
- Enhance customer experience: Data analytics tools help you understand customer preferences, enabling you to personalize shopping experiences and improve satisfaction.
Let’s cut to the chase and see some data analytics tools.
Most popular data analytics tools to know in 2023
Navigating the sea of data analytics tools can be daunting.
To simplify your search, we’ve compiled a list of the most popular data analytics tools in 2023. Discover the top contenders and find your business’s perfect match.
Let’s explore the elite players in the world of data analytics in 2023!
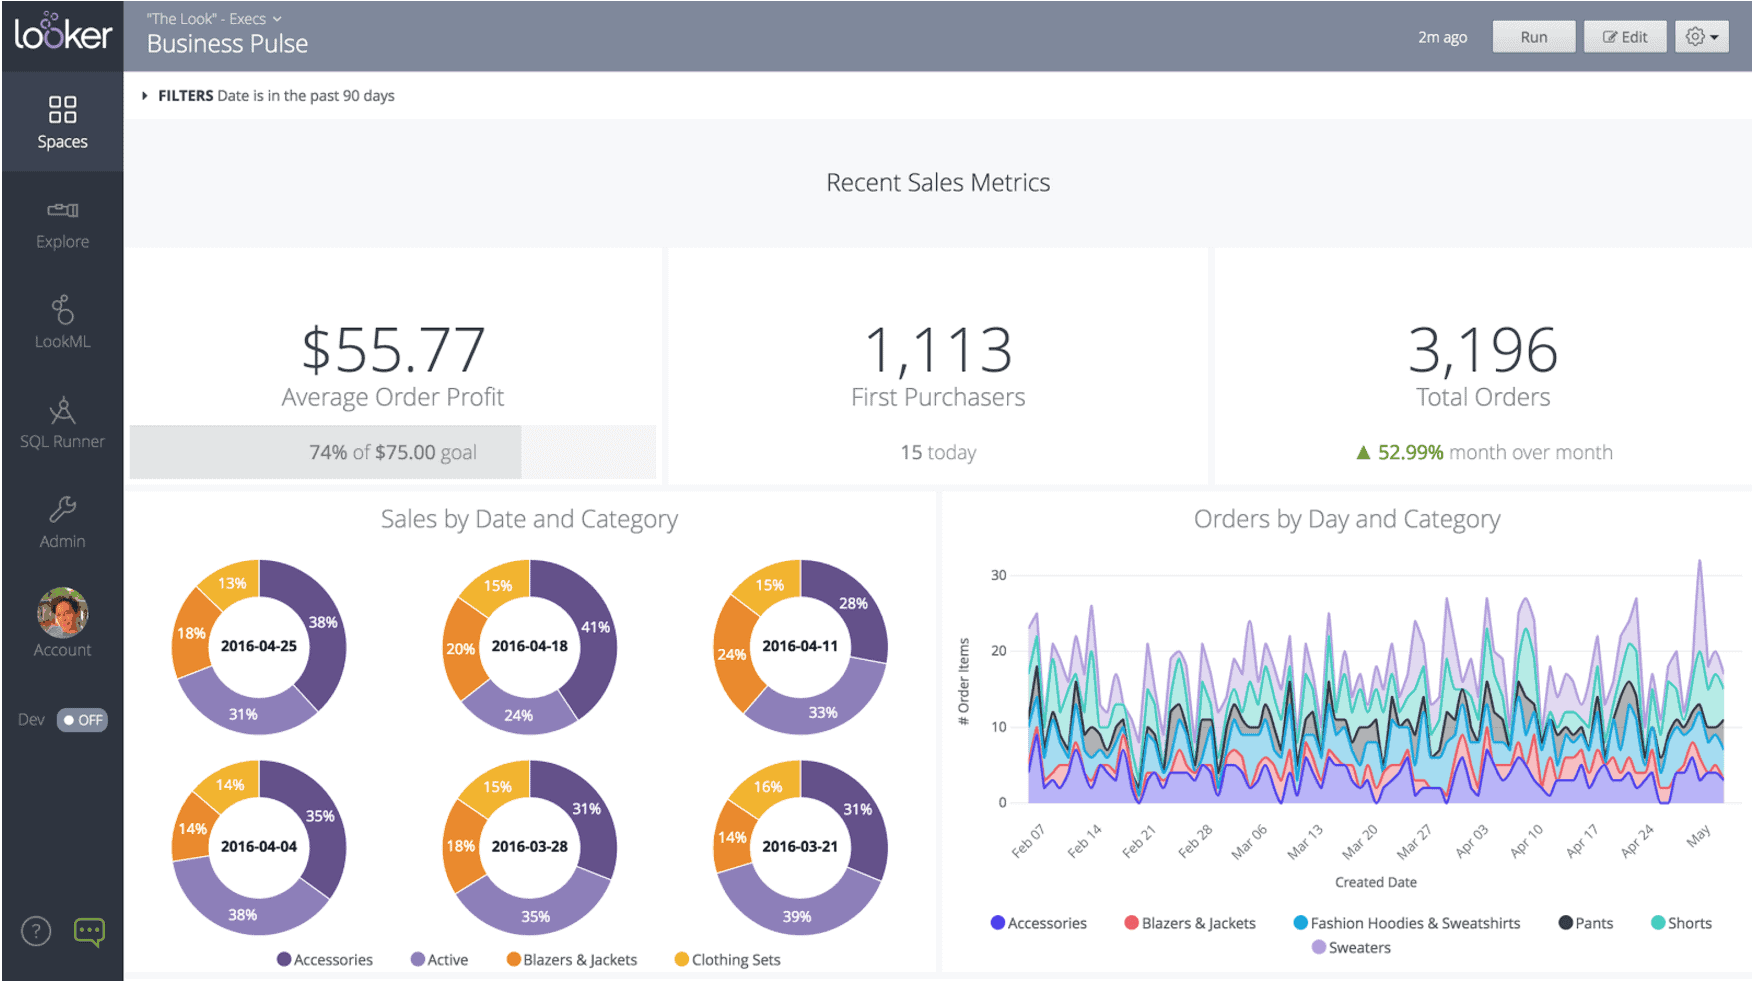
Looker
Looker is a data discovery platform that offers both on-premise and cloud deployment. It is known for its ease of use and fast implementation, achieved through its proprietary data modeling language.
Features:
- In-database and browser-based platform with integration to any SQL database or data warehouse.
- Self-service features such as pivoting, filtering, dashboard creation, and data visualization.
- User collaboration with access through browsers and mobile devices, sharing data through email or URL generation and integration with standard applications such as Microsoft Office and Google Docs.
Tool plan:
- Viewer user: $30/user/month
- Standard user: $60/user/month
- Developer user: $125/user/month
Putler
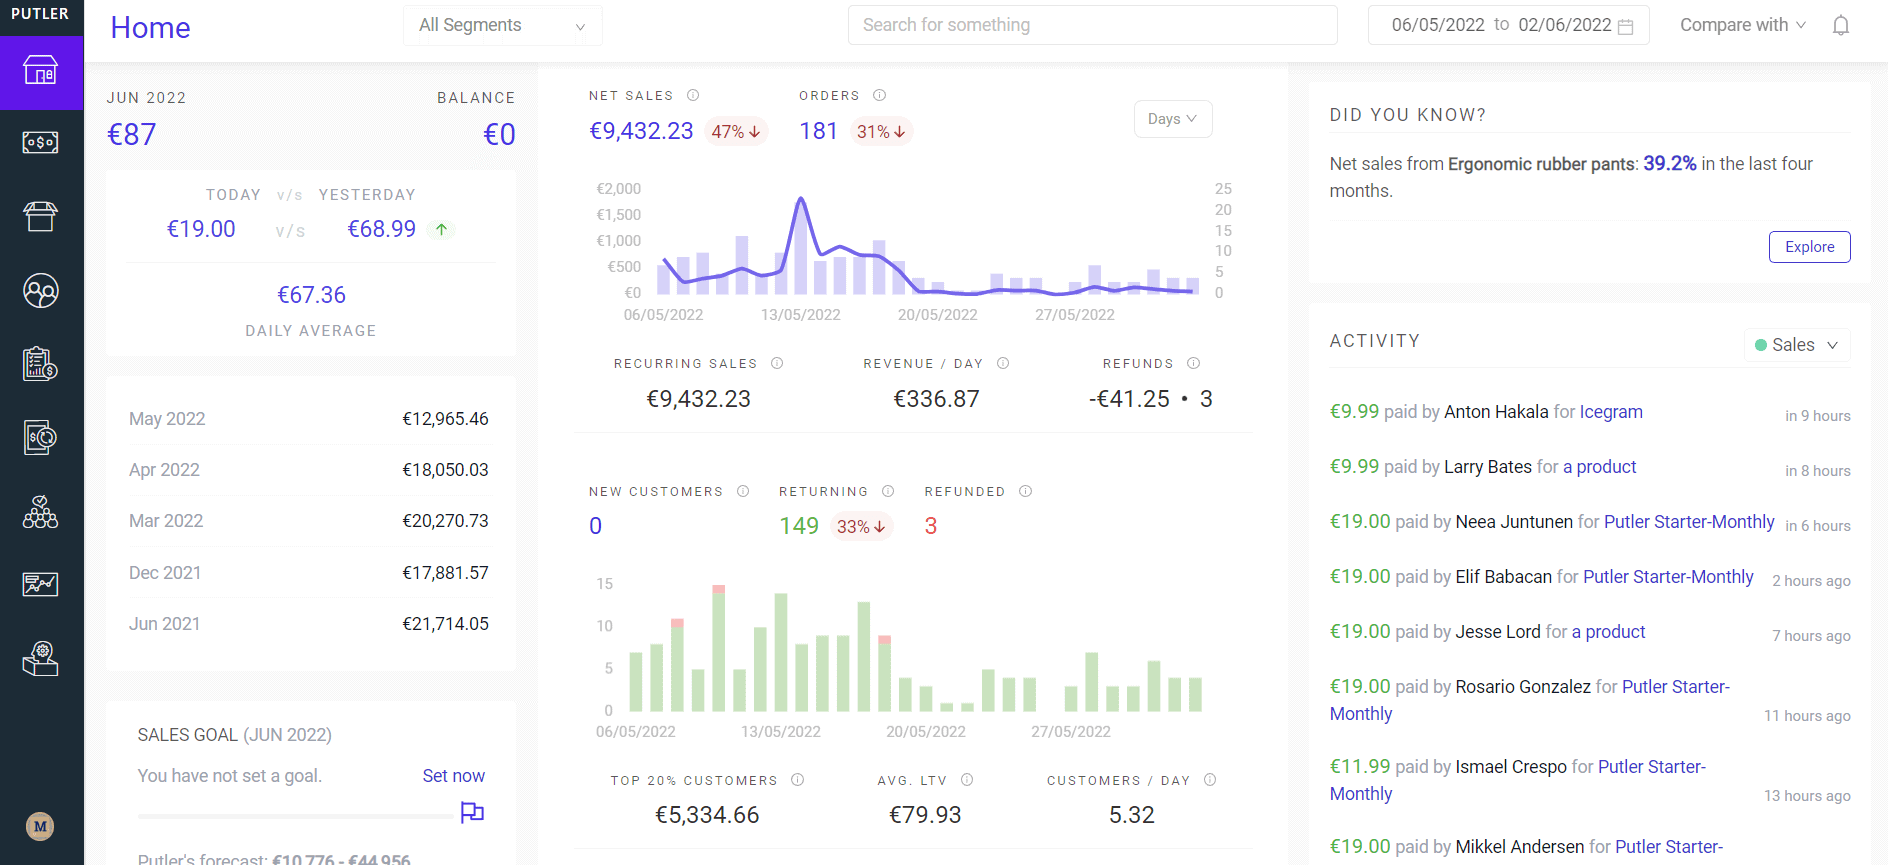
Putler provides you with detailed reports on your website’s performance and analytics. Your data is processed in real time, and you get accurate reports and key metrics. Other analytics tools lack the ability to handle eCommerce data, something Putler excels at.
Features:
- Multi-store reporting with custom segments
- Intuitive filters and management of refunds and subscriptions
- 153+ key performance indicators and reports for both SaaS and non-SaaS businesses.
- RFM customer segmentation and instant transaction lookup for effective business analysis.
Tool plan:
- Starter plan: $20 /per month
- Growth Plan: $50/per month.
It also offers a custom plan which you can tailor according to your needs.
You can create a free account and will get an outstanding reporting solution irrespective of the plan you select.
Zoho Analytics
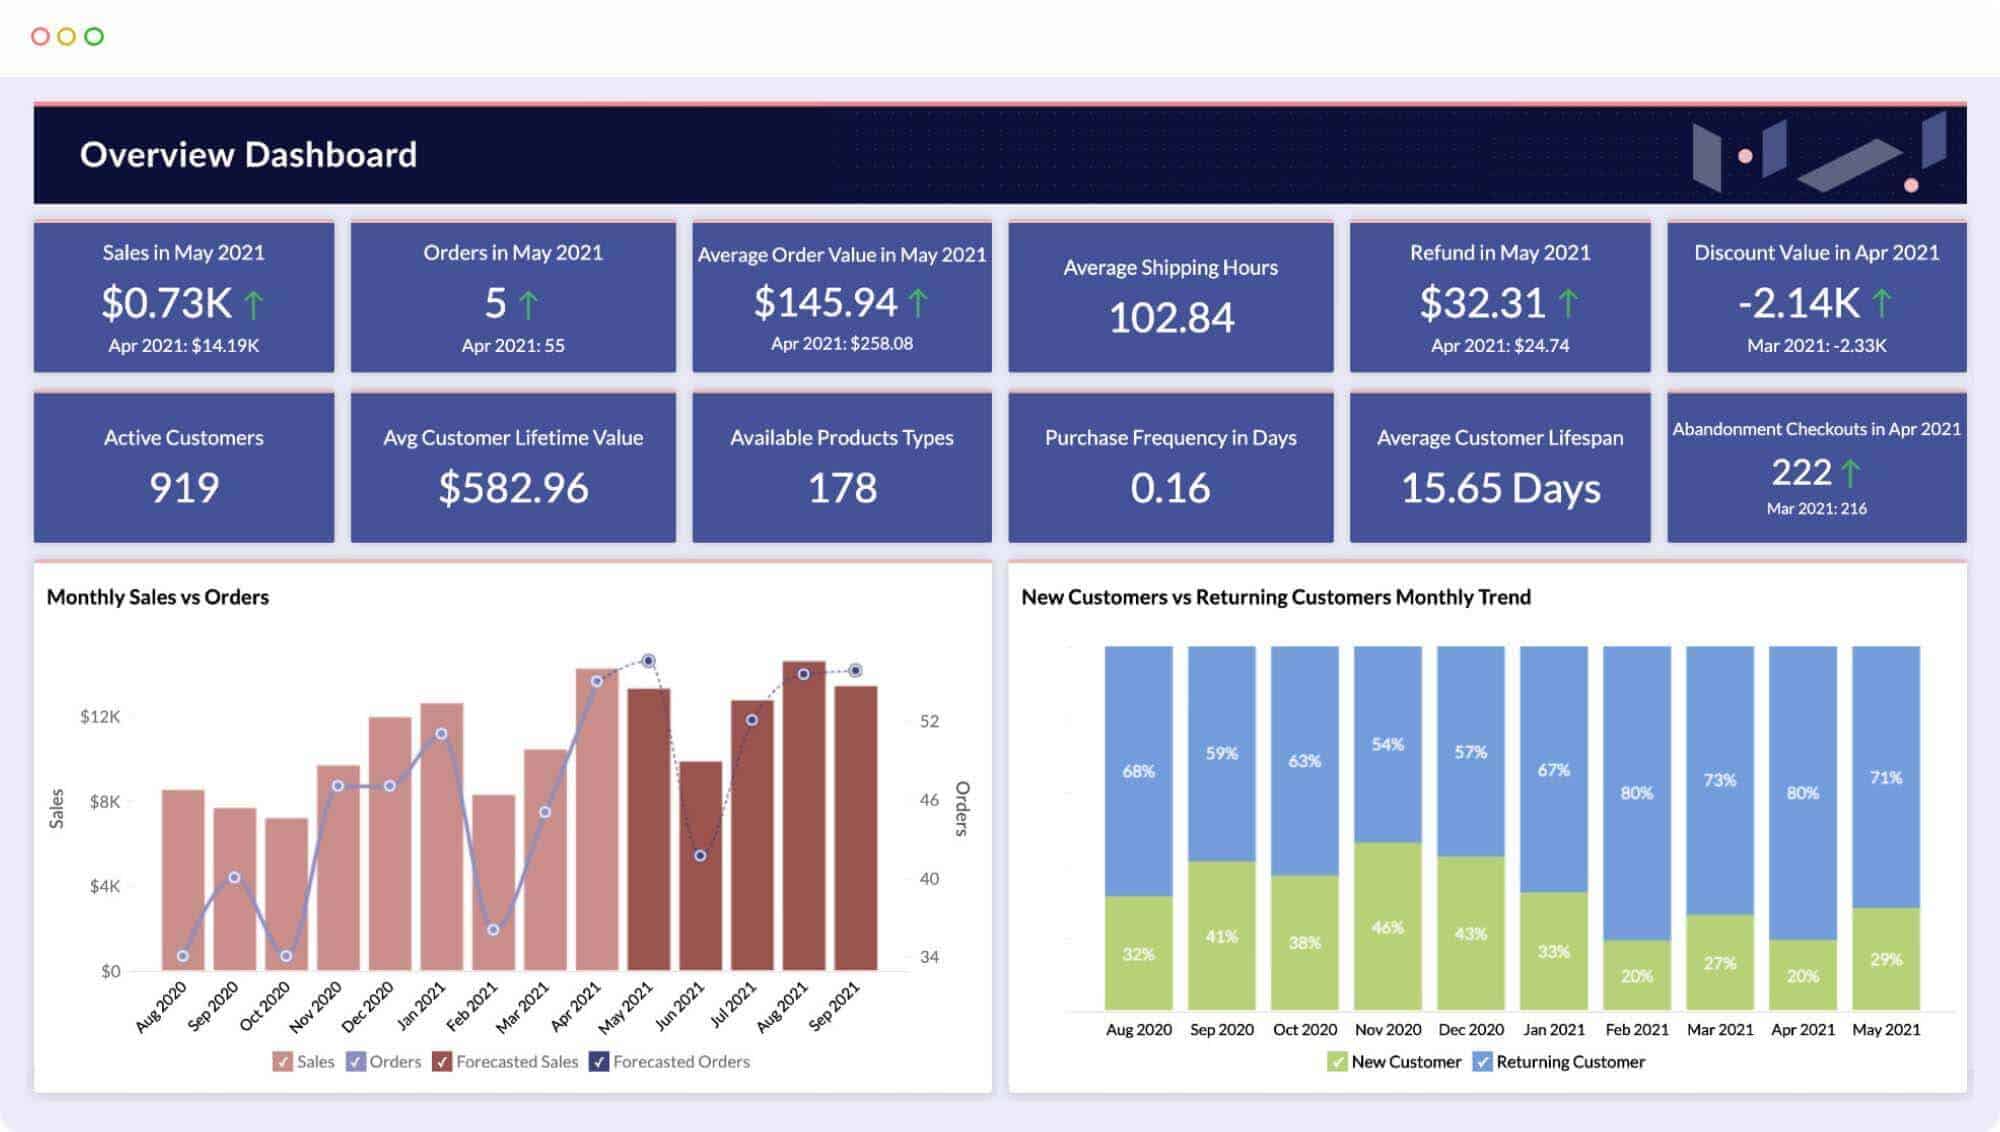
Zoho Analytics is a business intelligence platform that allows users to connect, prepare, and analyze data from any source with a drag-and-drop interface. It can be accessed from the cloud, public cloud, or on-premise, and offered as a white-label or embedded in another app.
Features:
- Connects to over 250 data sources and includes Zoho DataPrep for data preparation
- Advanced analytics features like NLP, predictive analytics, what-if analysis and alerts
- Data storytelling with slideshows or web portals
- Mobile accessibility through the Zoho Analytics Mobile BI app
- Offers embedded analytics via white-label solution for clients.
Tool plan:
- Basic: $59/month,
- Standard: $119/month
Klipfolio
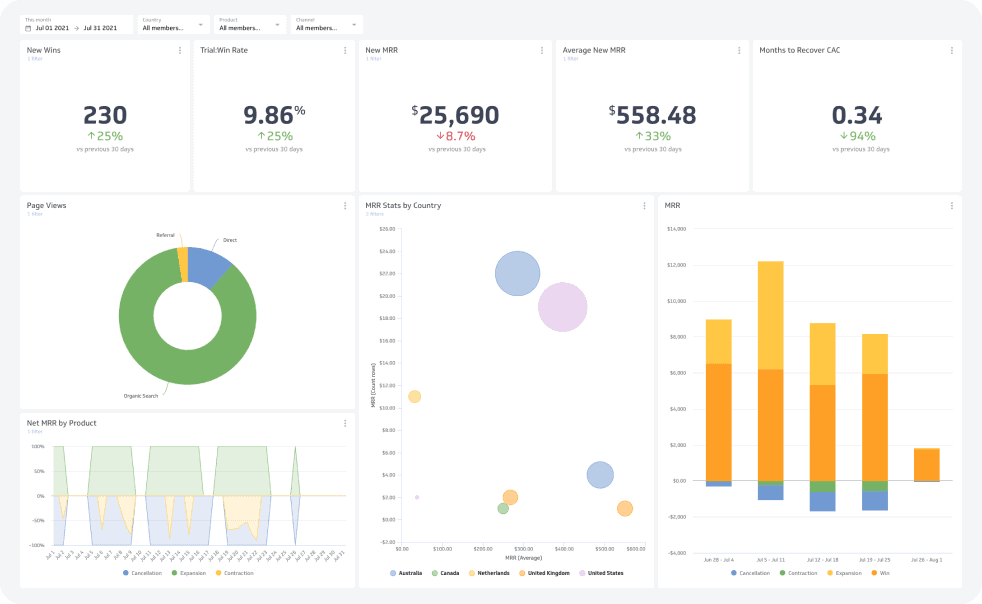
Klipfolio is a cloud-based data analytics and BI platform that allows businesses to connect to various data sources, create real-time data visualizations and share them in a secure and customizable manner.
Features:
- Connect data using 300+ integrations or REST/URL option
- Control presentation with iFrames, HTML, JavaScript, and CSS
- Transform data with Excel-like functions & formulas
- Automate client reporting with white label & client management options.
Tool plan:
- Go: $90/month
- Pro: $225/month
- Business: $800/month
Whatagraph
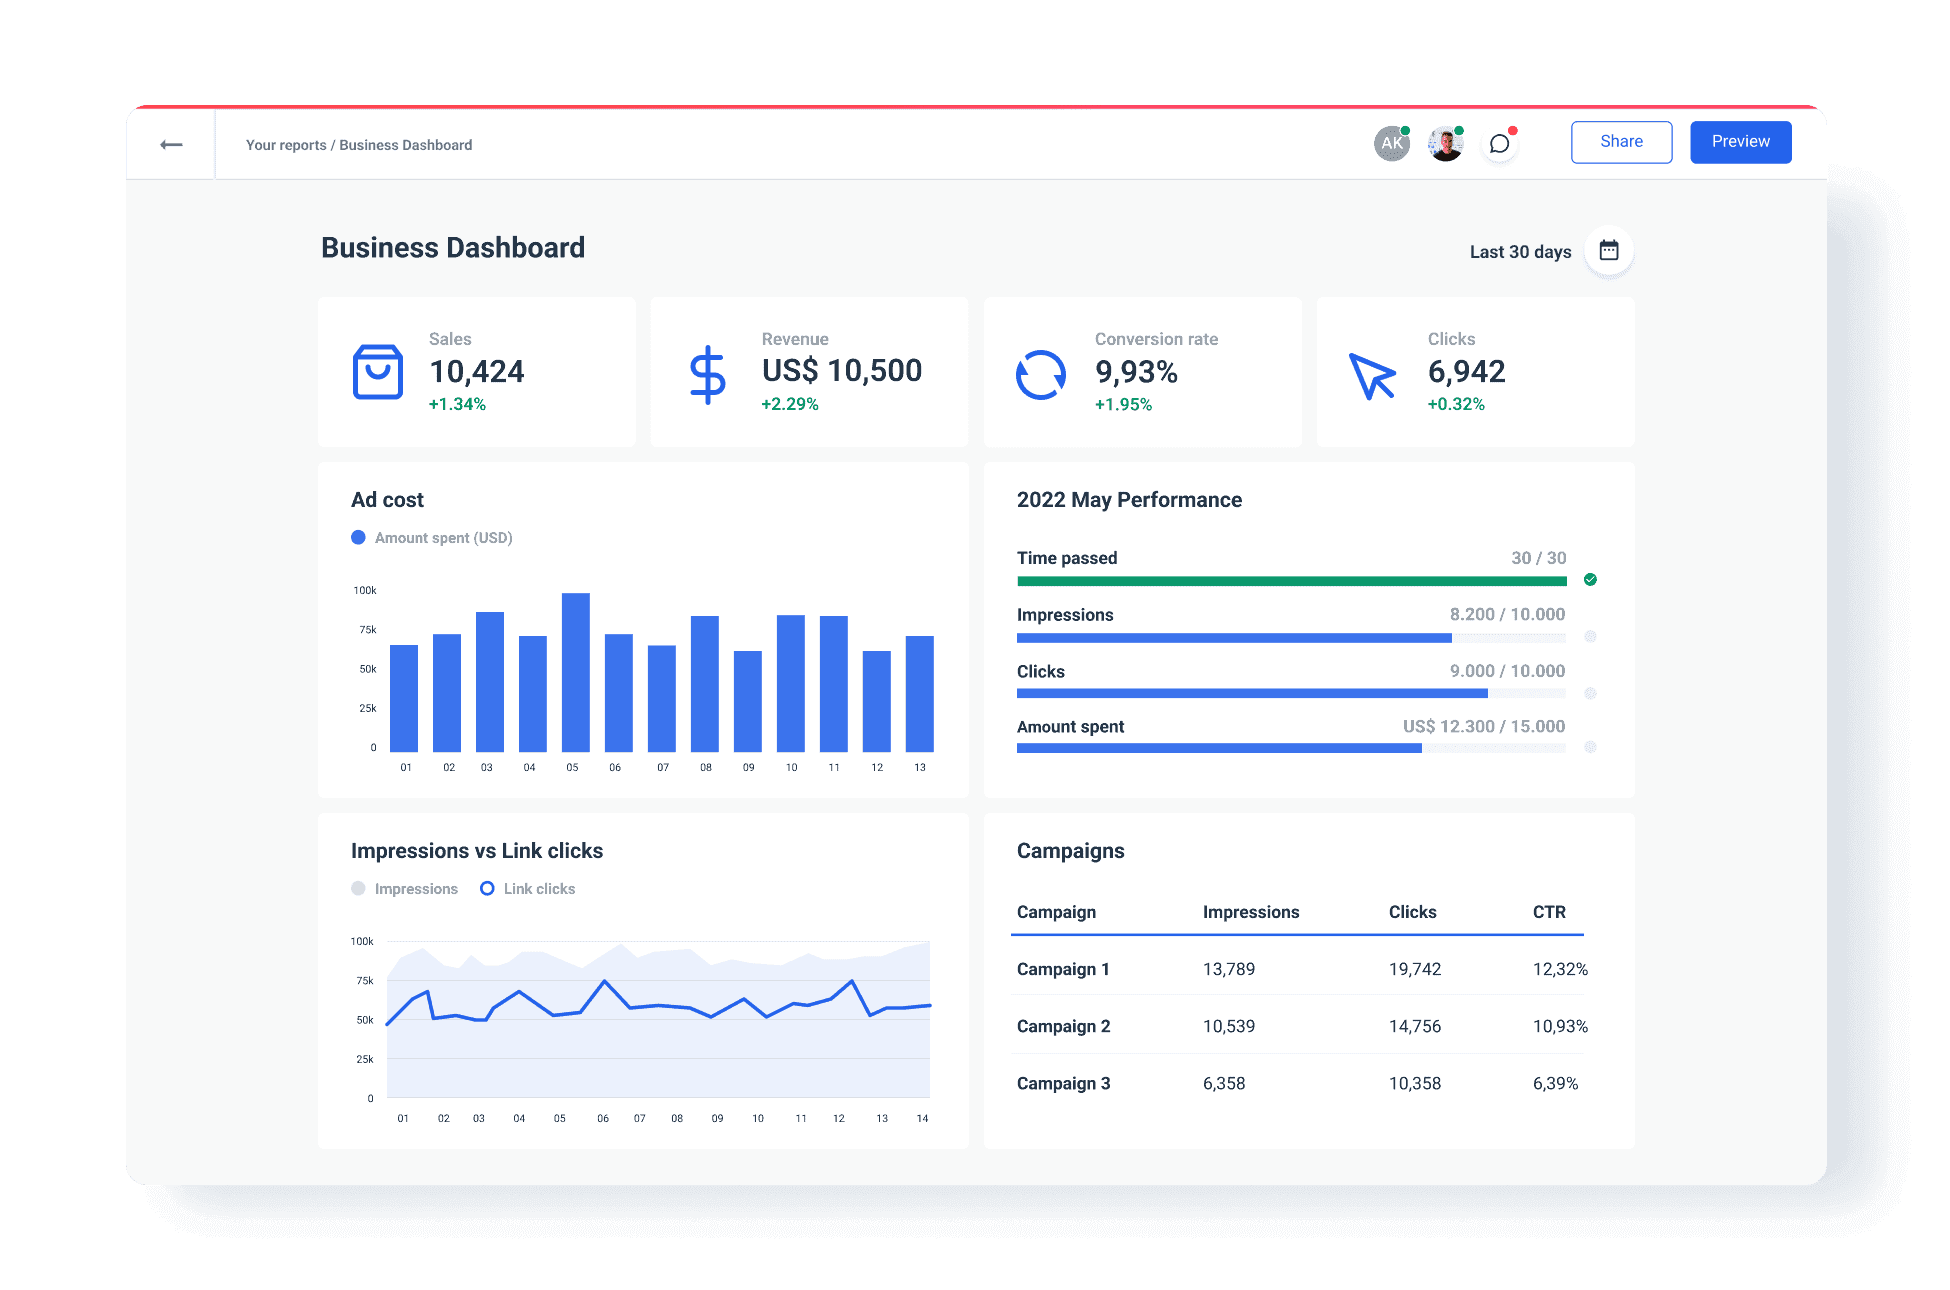
Whatagraph is a marketing reporting tool that automatically pulls data from 40+ sources, allowing users to create cross-channel reports and build visually appealing reports. With premade templates, it allows users to customize and style reports to suit their brand.
Features:
- Reports interface with graphs and charts
- Automated data collection from 40+ sources, including Facebook Ads and Google Analytics
- Multi-user access and collaboration with team members
- ROI tracking and spend management
- Custom branding with white label options
Tool plan:
- Professional: $223/month
- Premium: $335/month
- Custom: billed annually or quarterly
Google Data Studio
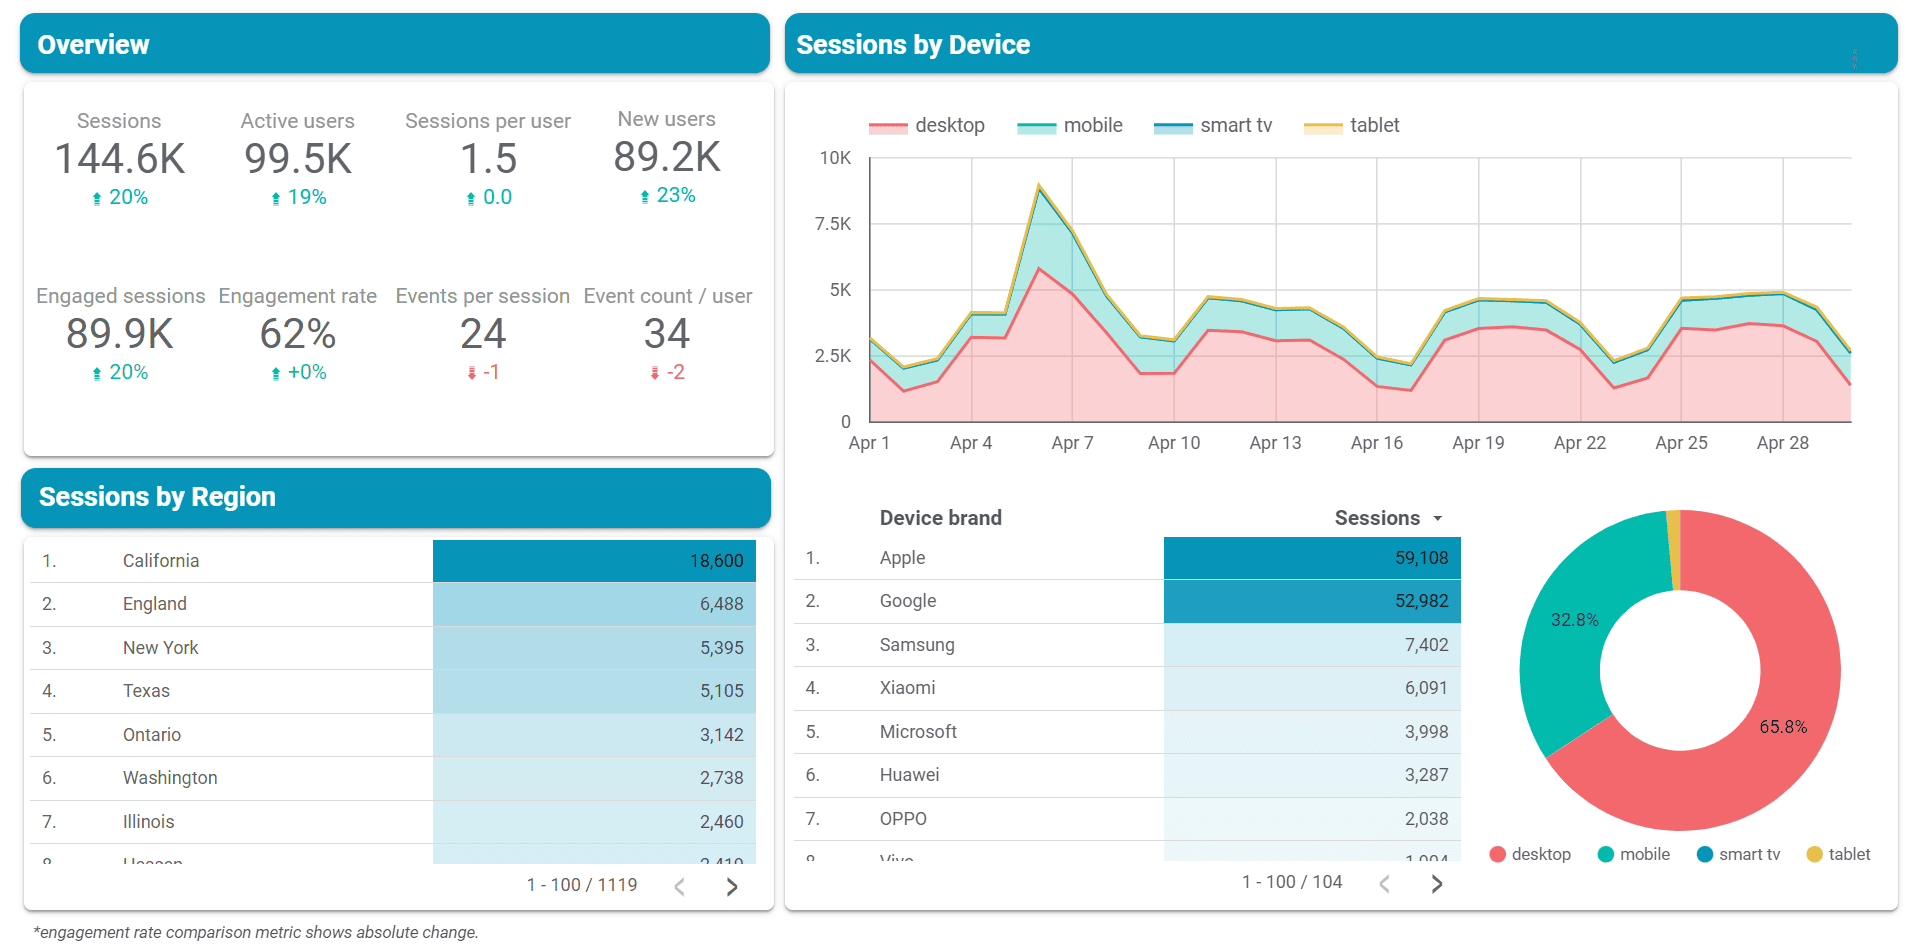
Google Data Studio is a simple data visualization tool built on top of Google’s data stack, with limited capabilities. It works best with organizations that use BigQuery and have established data cleaning and transformation processes.
Features:
- Create visually appealing charts and tables with customizable options
- Effortlessly connect to various data sources such as Google Ads and social media
- Share insights and Collaborate seamlessly on reports with your team or globally
- Speed up report creation using pre-made templates like Google Data Studio Facebook Ads template and others.
Tool plan:
Currently, Google Data Studio is available for free as part of the Google Cloud Platform, however, it is expected that Google will introduce paid options in the future, similar to the business model of Google Analytics and Google Analytics 360.
Tableau
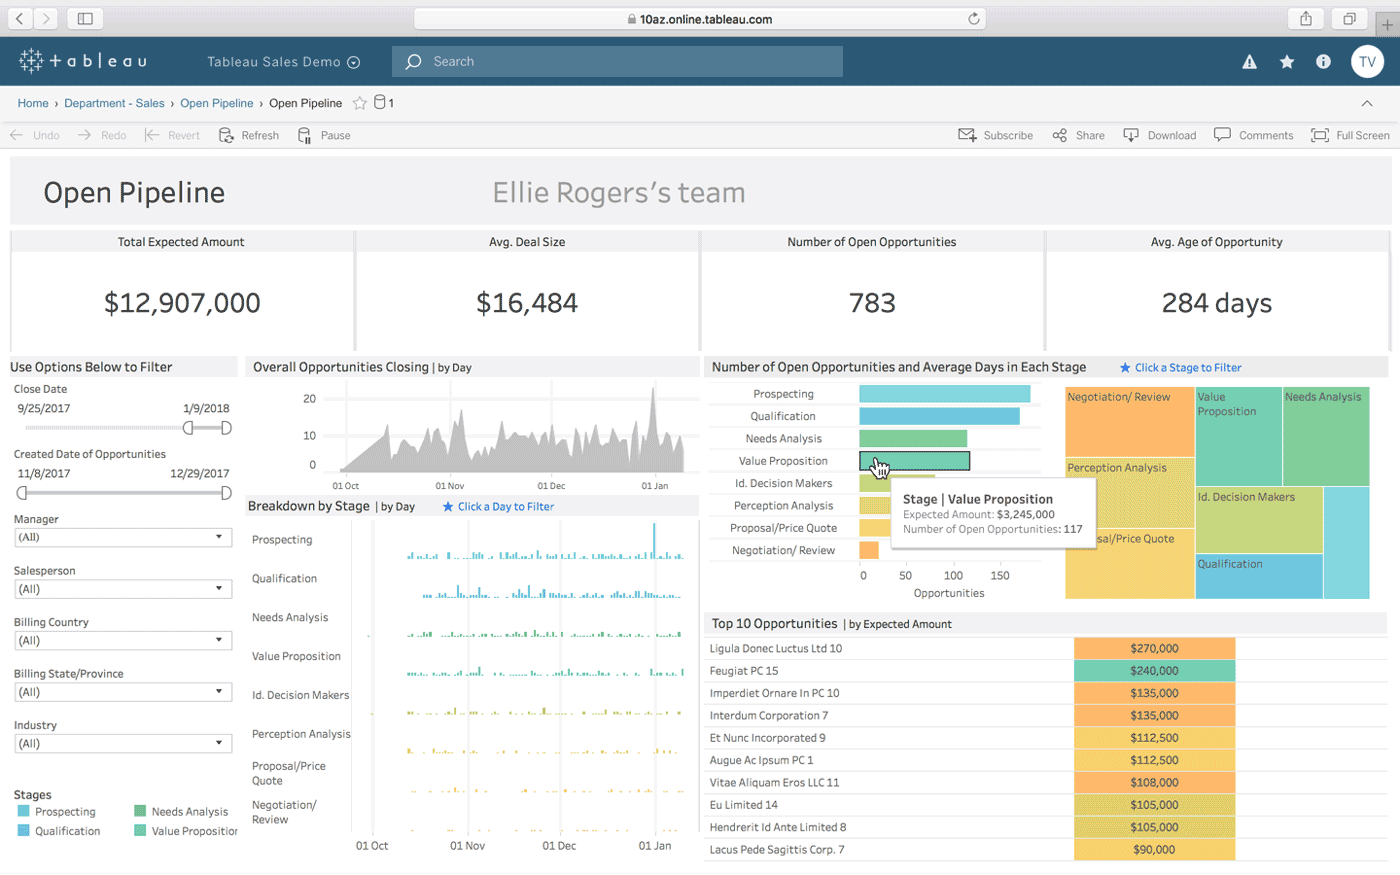
Tableau offers intuitive business intelligence tools to help users analyze, visualize and share data. Tableau has three main products for data discovery: A desktop for analyzing data and creating reports, a Server for secure collaboration, and Cloud for cloud-hosted data discovery. Other Tableau products include Tableau Mobile, Tableau Public, and Tableau Prep Builder.
Features:
- Multiple data connections, live and in-memory data, secure collaboration, mobile-optimized designs, drag-and-drop integration, unlimited data connectors, metrics, set control and more.
- Tableau’s Q4 2020 release includes enhancements such as Tableau Prep Builder, offline map support in Tableau Server and Redshift spatial support.
Tool plan:
- Creator: $70/user/month
- Explorer: $35/user/month
- Viewer: $12/user/month
Talend
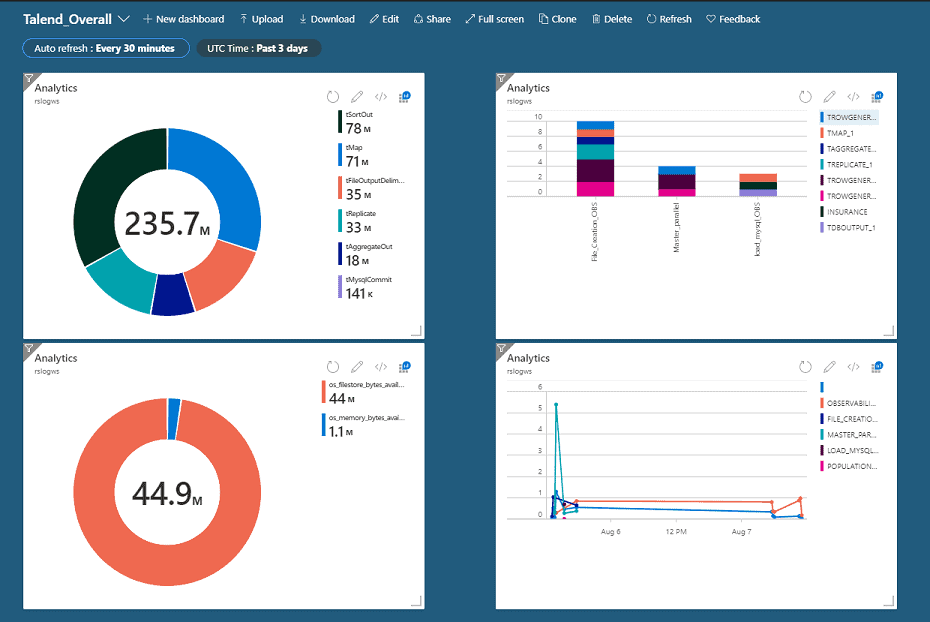
Talend is an Open-source data integration and management platform providing big data ingestion, transformation and mapping, cross-network connectivity, data quality and master data management, based on Eclipse, Java and SQL with reusable pipelines and no proprietary lock-in.
Features:
- Web Services and Data Extraction can extract information such as pricing, phone numbers, email addresses, and images from multiple sources.
- Metadata and Master Data Management ensures proper management and organization.
- Provides a centralized platform to monitor and visualize extracted information and supports the ETL process.
Tool plan:
Talend, which offers a versatile data integration solution, requires a quote to obtain pricing information.
- Monthly: $1,170/user
- Annual: $12,000/user
Dataiku
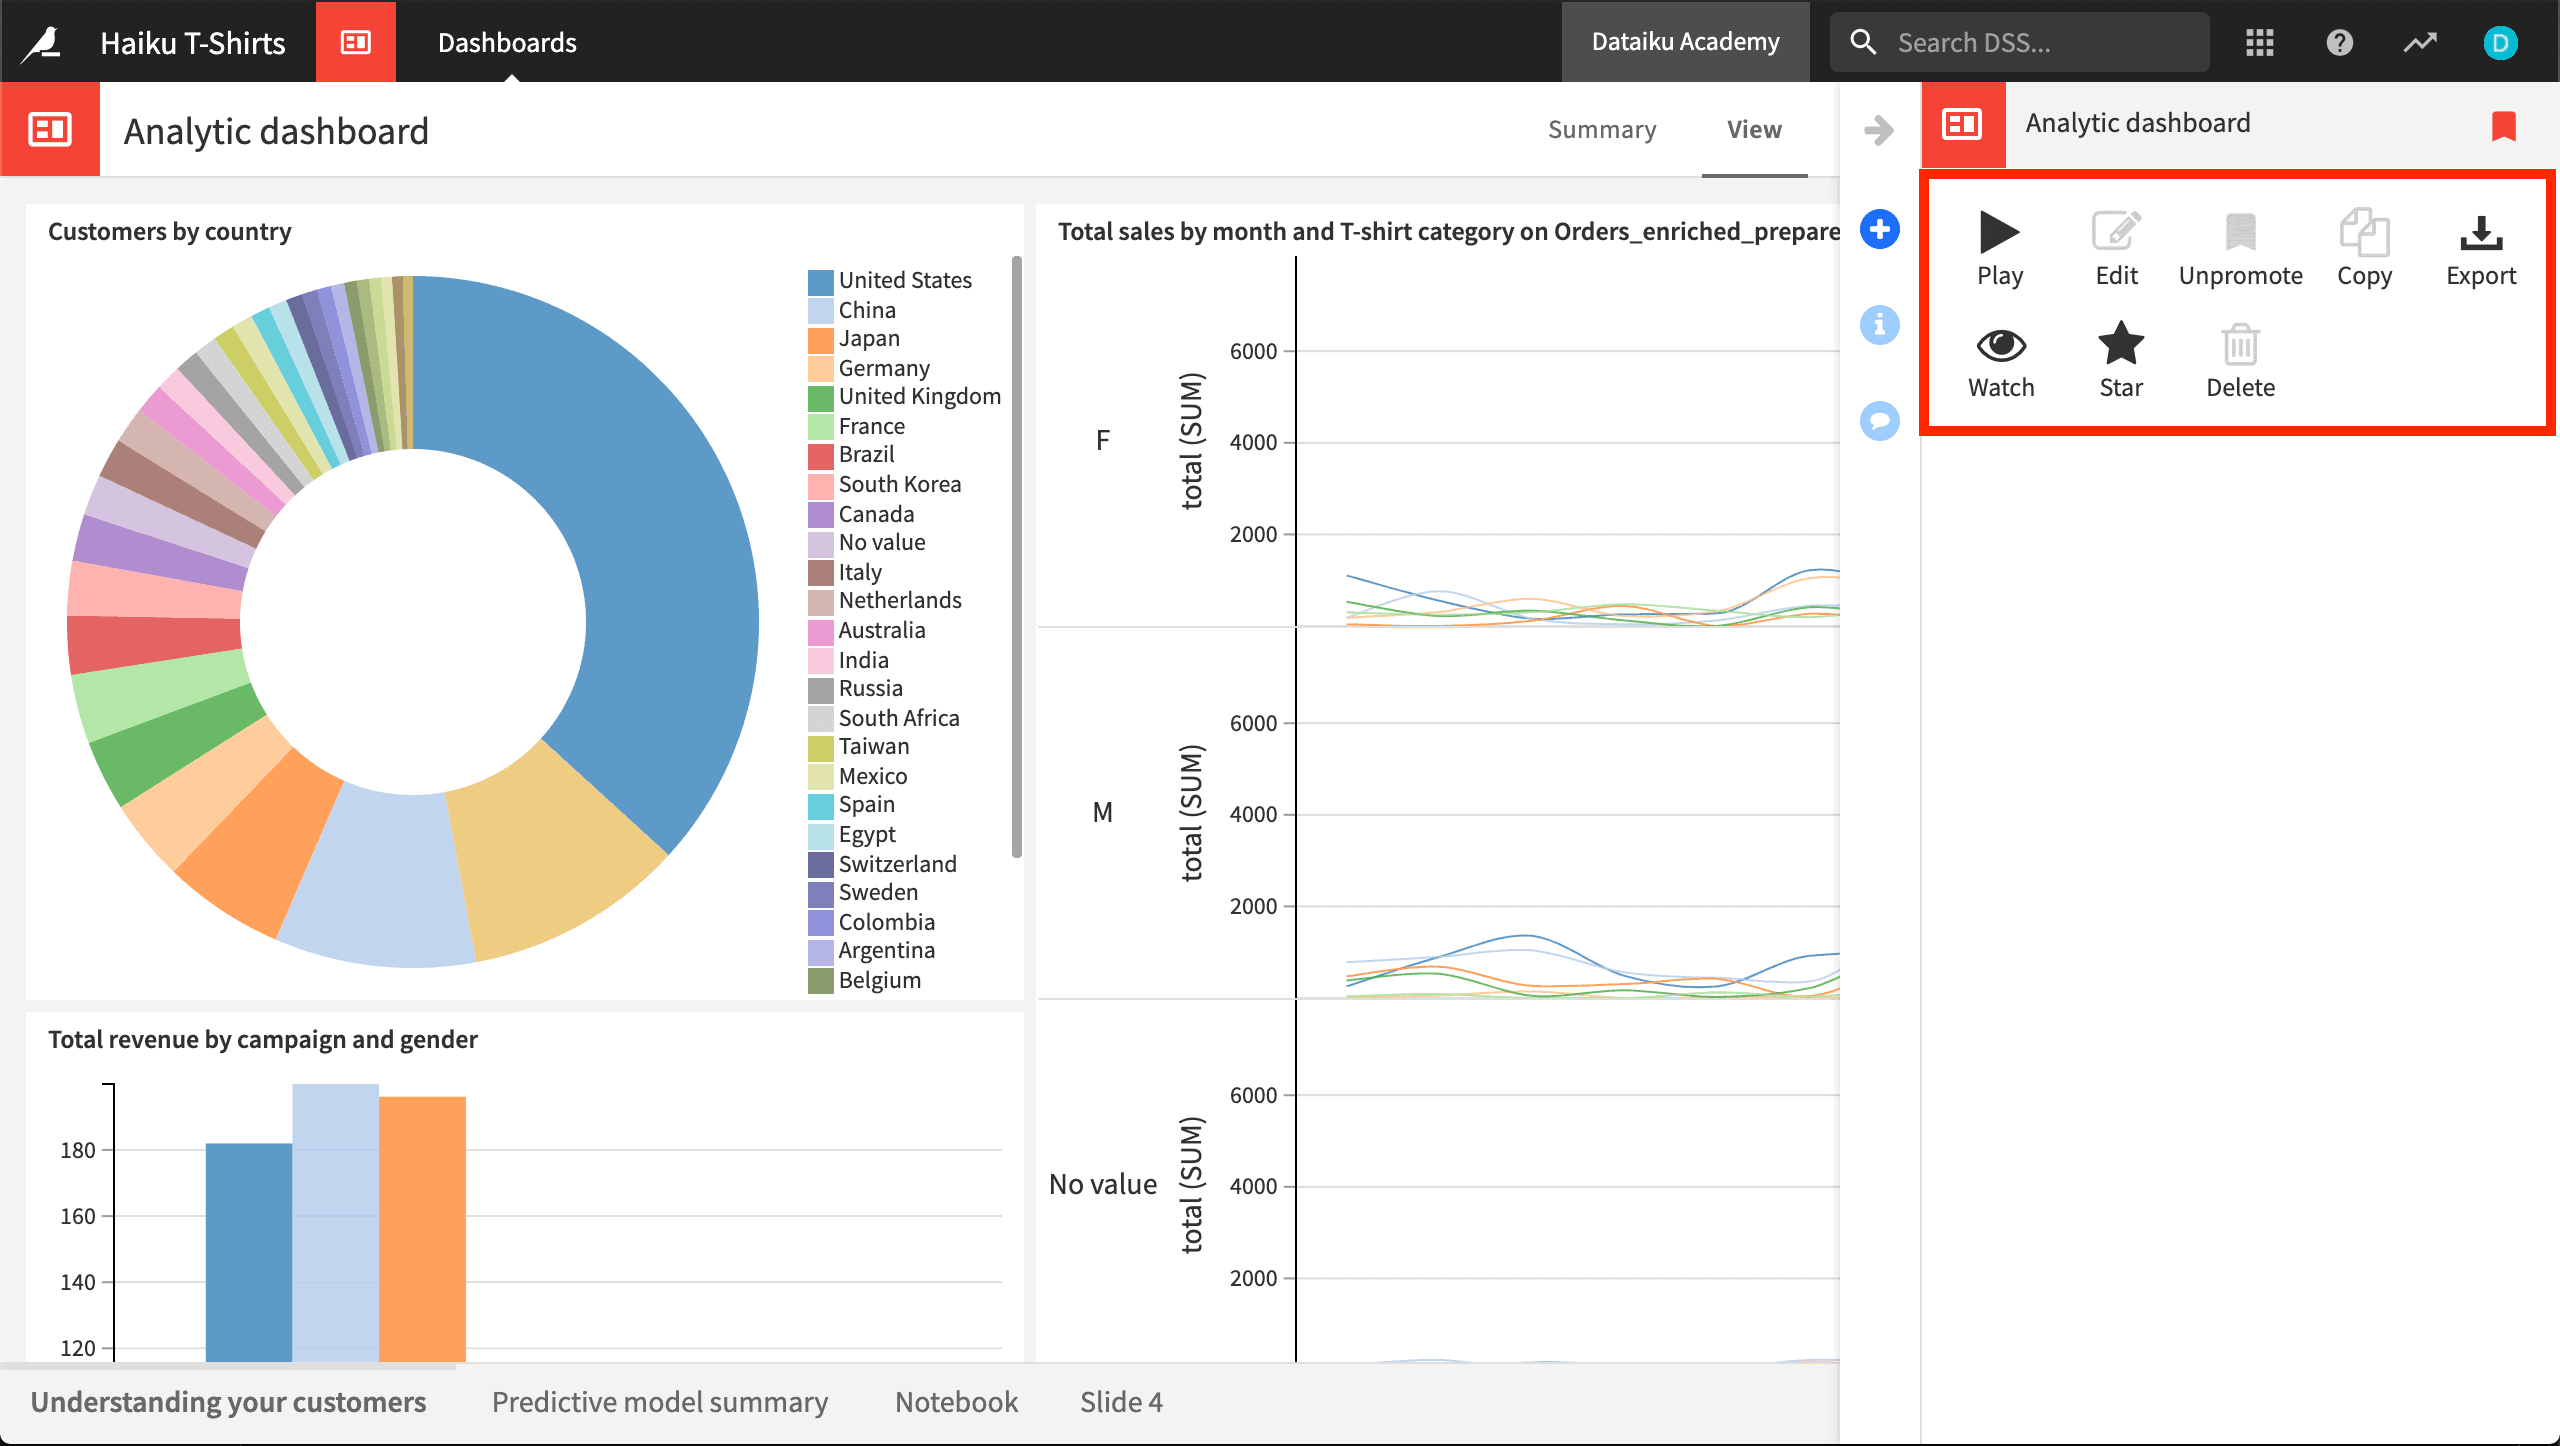
Dataiku is an AI-powered data analysis software with advanced reporting and analytics capabilities. Suitable for organizations across industries, offering data preparation, ML analysis, and metrics reporting. Available for local installation or hosting on cloud platforms AWS and GCP.
Features:
- It includes access controls, collaboration tools, and a range of data management capabilities.
- It facilitates data discovery, extraction, and visualization for deeper insights.
- Supports deep learning, machine learning, predictive analytics, and statistical modeling.
- It includes model training, NLP, automation, self-service analytics, sentiment analysis, and customizable templates
Tool plan:
To get a quote for Dataiku, reach out to their team and collaborate with a pricing specialist who will assist you in determining your requirements and budget.
Which is the best tool for data analytics?
When it comes to selecting the best tool for data analytics, Putler emerges as the top choice.
Here are the key reasons why Putler stands out:
- Unified data integration: Putler excels at consolidating and unifying data from various sources, providing a comprehensive view of your business performance.
- Extensive analytics capabilities: Putler offers a wide range of analytics features, including sales analysis, customer segmentation, product performance insights, and revenue forecasting.
- User-friendly interface: With its intuitive design and easy navigation, Putler caters to both technical and non-technical users, enabling efficient data analysis without steep learning curves.
- Tailored for eCommerce and SaaS businesses: Putler is specifically designed to meet the needs of eCommerce and SaaS businesses, providing industry-specific metrics and insights.
- Cost-effective solution: Putler offers powerful analytics capabilities at a competitive price, delivering exceptional value for businesses of all sizes.
- Customer support: Putler provides reliable customer support to assist users in getting the most out of the tool and addressing any queries or concerns.
By considering these factors, it’s evident that Putler emerges as the ultimate tool for data analytics.
With Putler, businesses gain the power to make informed decisions, unleash their full potential, and achieve remarkable growth.
Get Started with Data Analytics Tools
Congratulations on getting started!
By picking the right data analytics tool, you’ll turn your raw data into useful insights that can give you a big advantage over your competition.
This choice is personal to your business, so find a tool that fits your needs and goals. Dive into your options, compare features, and make a smart choice.
The perfect tool is waiting for you. So, start exploring and let your data help your business succeed.
