Success in eCommerce comes down to numbers—tracking trends, measuring progress, and making sharp decisions.
But you don’t need to be a math whiz to understand what’s driving your growth. It’s about focusing on the right metrics and letting data guide your next move.
From total sales and lifetime value to conversion rates and profit margins, the math behind eCommerce growth is practical and powerful.
In this article, we’ll break down essential metrics and show how simple calculations can lead to smarter business decisions.
Understanding Key Metrics
So, let’s start with key metrics.
Total Sales
Total sales is the foundation of eCommerce growth analysis. It’s a straightforward calculation:
Total Sales = Sum of All Sales Transactions.
For example, if your store made $5,000 in January and $6,500 in February, your total sales for those months would be $11,500.
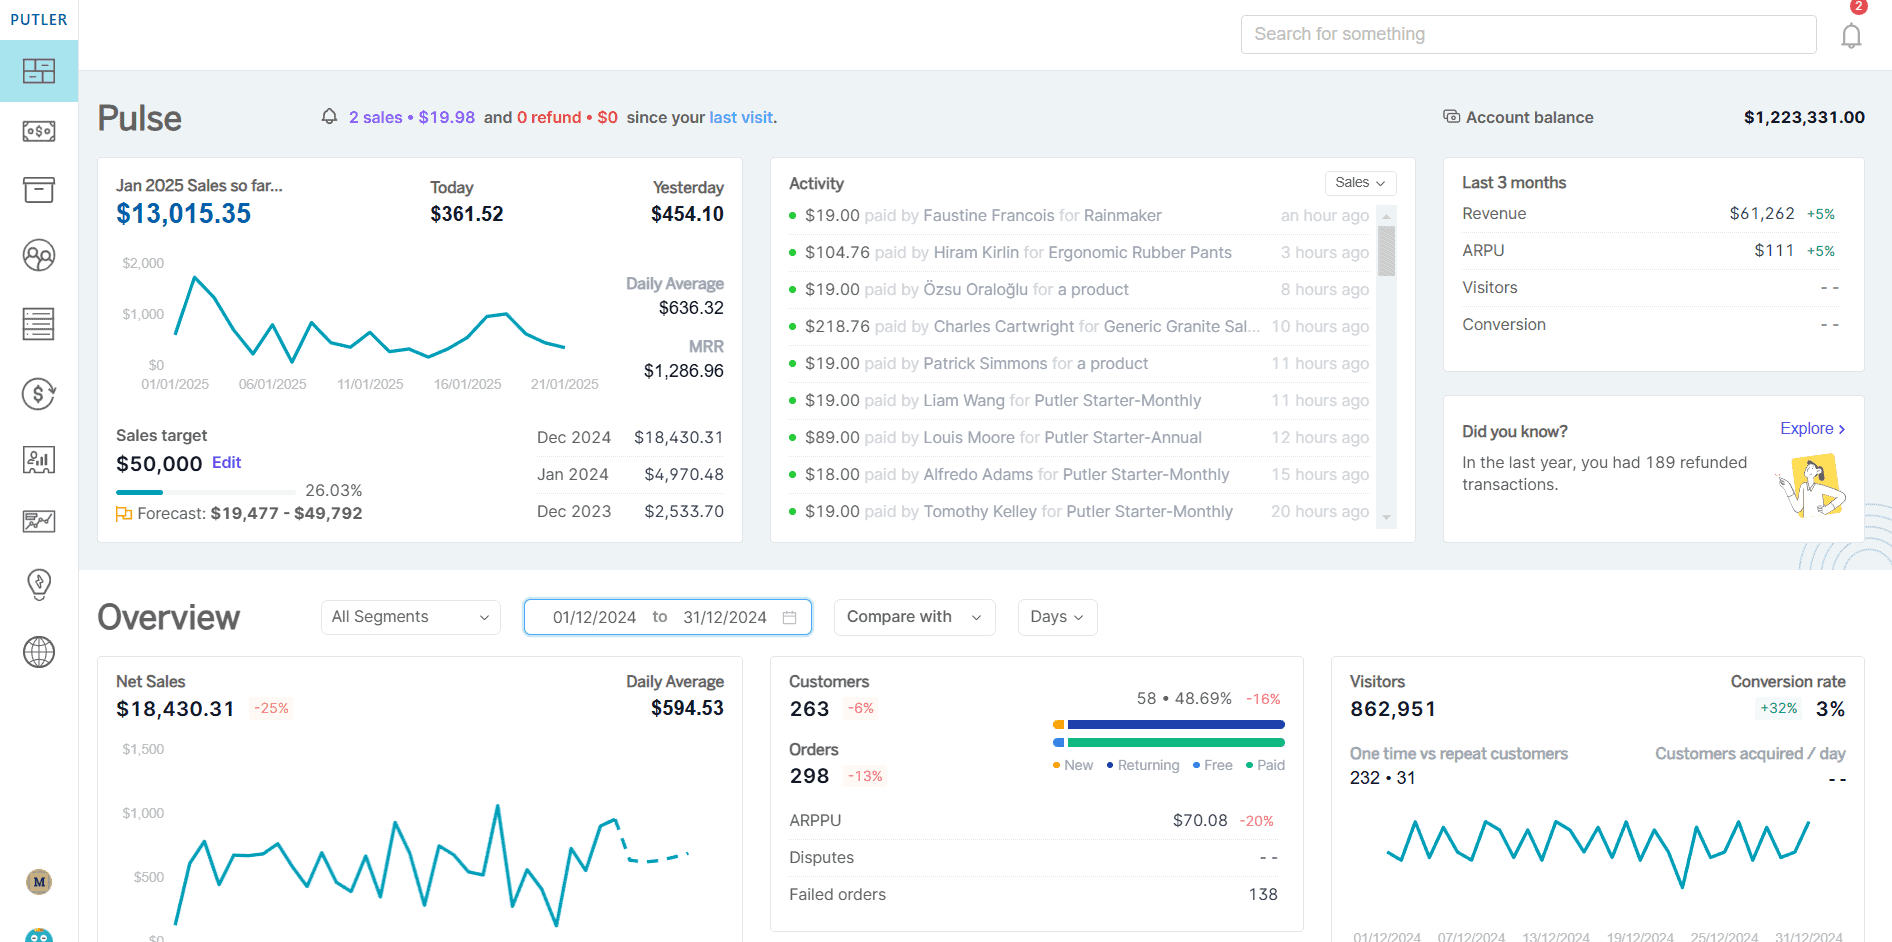
Instead of manually tracking this, Putler’s dashboard automates the process, consolidating sales data from multiple sources in real time.
This eliminates the need for spreadsheets and manual calculations, giving you an accurate snapshot instantly.
Average Daily Sales
Understanding daily sales helps in spotting trends and making quick adjustments. The formula is simple:
Average Daily Sales = Total Sales / Number of Days in Period.
If your store generated $9,000 over 30 days, the average daily sales would be $300 per day.
With Putler, you don’t have to crunch these numbers yourself—it automatically tracks and displays daily sales trends, helping you identify slow days and peak sales periods.
Year-over-Year Growth

To measure long-term progress, you need to compare sales across the same period in different years:
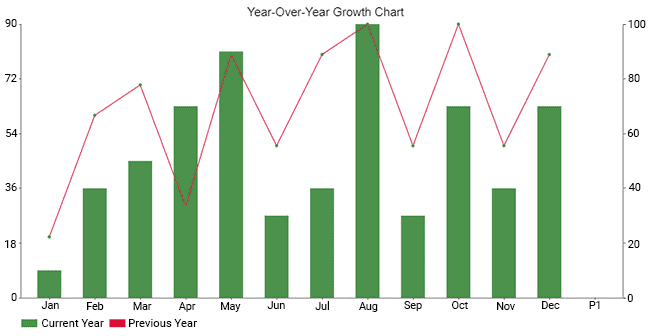
Year-over-Year Growth (%) = [(This Year’s Sales – Last Year’s Sales) / Last Year’s Sales] × 100.
For instance, if your sales in January 2023 were $10,000 and in January 2024 they reached $12,000:
YoY Growth = [(12,000 – 10,000) / 10,000] × 100 = 20%.
With Putler, you don’t need to dig through old reports. Its real-time analytics instantly calculate and visualize growth trends, making comparisons effortless.
Sales Growth Rate
Tracking your sales growth rate allows you to see how your revenue is expanding over time:
Sales Growth Rate (%) = [(Sales in Current Period – Sales in Previous Period) / Sales in Previous Period] × 100
For example, if you earned $8,000 last month and $9,600 this month:
Growth Rate = [(9,600 – 8,000) / 8,000] × 100 = 20%
Putler’s real-time insights automatically update and display these metrics, helping you make quick, data-backed decisions.
Repeat Purchase Rate
A high repeat purchase rate indicates strong customer loyalty. The formula:
Repeat Purchase Rate (%) = (Returning Customers / Total Customers) × 100
If 200 out of 1,000 customers made repeat purchases:
Repeat Purchase Rate = (200 / 1,000) × 100 = 20%
With Putler, you can see repeat purchase rates visually, making it easy to track and improve customer retention strategies.
Net Profit

Net profit determines your actual earnings after expenses:
Net Profit = Total Revenue – Total Expenses
For example, if your revenue is $15,000 and expenses are $10,000, your net profit is $5,000.
Gross Profit
Gross profit focuses on revenue after deducting the cost of goods sold (COGS):
Gross Profit = Revenue – COGS
If your sales revenue is $20,000 and your COGS is $8,000, your gross profit is $12,000.
Conversion Rate
Your conversion rate measures how well your store turns visitors into buyers:
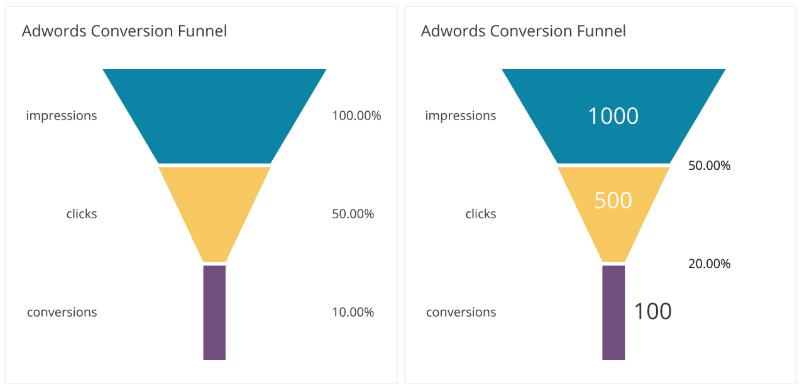
Conversion Rate (%) = (Number of Purchases / Number of Visitors) × 100
If you had 5,000 visitors and 250 purchases:
Conversion Rate = (250 / 5,000) × 100 = 5%
Putler’s analytics track conversion rates in real-time, allowing you to adjust your marketing strategies based on actual data.
Average Order Value (AOV)
AOV helps determine how much customers spend per transaction:
AOV = Total Revenue / Number of Orders
If your total revenue is $50,000 from 1,250 orders:
AOV = $50,000 / 1,250 = $40
Putler provides instant AOV insights, helping you optimize pricing and upselling strategies.
Lifetime Value (LTV)

LTV predicts the total revenue a customer will bring over their relationship with your business:
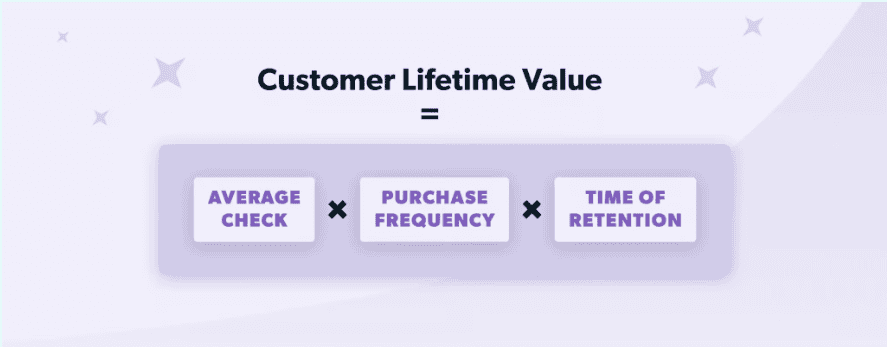
LTV = Average Order Value × Purchase Frequency × Customer Lifespan
If your AOV is $40, customers buy 5 times per year, and the average customer stays for 3 years:
LTV = $40 × 5 × 3 = $600
Putler automates LTV calculations, helping you adjust marketing spend and retention strategies efficiently.
Next, let`s discuss how these metrics are helpful for your eCommerce growth and how to calculate them.
Math Skills Required for eCommerce Growth Calculation
So, here are 6 basic skills needed for the eCommerce growth calculation:
- Basic Arithmetic: Addition, subtraction, multiplication, and division form the foundation of eCommerce calculations. They allow companies to determine total sales, net profit, and average order values.
- Percentage Calculations: Interpreting conversion rates, growth rates, and profit margins requires working with percentages.
- Algebra: Algebra is helpful in solving for unknowns, such as predicting future sales or determining required conversion rates to meet targets.
- Statistics: Analyzing sales data by mean, median, and mode shows customer trends and inclinations. Standard deviation and trend analysis also help in market prediction.
- Data Analysis: Interpreting sales trends and identifying patterns are crucial for business growth. Data analysis also includes interpreting raw data and making actionable decisions.
- Excel and Spreadsheet Skills: While Excel is a well-known environment for data calculation and structuring, Putler reduces the need for manual spreadsheets. Automated reports handle complex formulas so that businesses can spend more time working on insights rather than data assembly.
If you want your kids to become entrepreneurs in the future, they can attend online math classes. There, they can learn all these skills and become well-versed in mathematics, which will help them in life.
For everything discussed above, data collection is important. Let`s discuss the main data collection methods in 2025.
Data Collection Methods
Reliable data is the backbone of eCommerce decision-making. Key methods include:
- Using Google Analytics: Tracks user behavior, sales trends, and traffic sources.
- Integrating eCommerce platforms with analytics tools: Putler syncs with WooCommerce, Shopify, PayPal, and Stripe, consolidating data from multiple sources.
- Customer feedback and surveys: Gather insights to improve products and services.
With Putler, all this data is pulled into a single dashboard, reducing manual effort and ensuring accuracy.
Data collection is just half the problem. Next, data analysis is necessary.
Data Analysis Techniques
Understanding sales trends requires effective analysis:
- Identifying patterns: Spot seasonal fluctuations and product demand shifts.
- Using statistical methods: Mean, median, and mode help break down sales performance.
- Interpreting data for decisions: If sales dip, adjust marketing or inventory strategies accordingly.
Putler’s real-time analytics eliminate guesswork, providing clear visualizations to make informed choices.
So, all this is clear. But how do we actually implement a data-driven strategy in 2025?
Implementing Data-Driven Strategies

Thanks to analytics tools like Putler, eCommerce businesses can set realistic, targeted goals based on up-to-date information.
It is simple to track performance against goals using Putler’s easy-to-use dashboards, providing a window into sales trends and consumer behavior.
Putler helps eCommerce businesses make effective marketing campaigns by breaking down:
- Sales data
- Customer segments
- Purchasing patterns
Putler’s real-time reporting recognizes conversion rates. Using these analytics, companies can highlight sales trends that indicate problem areas and implement change.
By simplifying checkout processes or highlighting best-selling products, for example, they can improve sales.
By tracking repeat purchase rates and lifetime value in Putler, businesses can ascertain customer satisfaction.
Conclusion
Math skills are crucial for analyzing eCommerce growth, but you don’t need to be a statistician to make sense of your data. Being able to effectively interpret data allows businesses to make the correct decisions, identify trends, and optimize their strategy.
This is where Putler comes in handy. With the automation of complicated computations, Putler not only gives you valuable time but also minimizes the risk of human error. You get the data that is correct as well as actionable.

Previously, Vanessa worked as a marketing manager for a tech software startup company.
