Every business is on the continuous lookout to create an exceptional customer experience. To be successful, the not-so-secret entity is data.
The marketing teams of organizations and analytics companies are striving to improve the accuracy of their analytics software, aiming to maximize customer engagement.
One such modern tool, designed with the future of the digital era in mind, is Google Analytics 4 (GA4).
At present, over 55% of all websites use Google Analytics, covering the largest market share of about 27%. Consequently, when Google brings updates to their analytics tool, you must also brush up your knowledge.
Here, let’s talk about Google Analytics in detail.
What is GA4?
On October 14th, 2020, Google announced its new analytical venture, Google Analytics 4 or GA4. This tool emphasizes building the user journey and improving user management.
The core of GA4 is built using Machine Learning as it fills the gaps from the previous versions. It drives the flow of insights without compromising the user’s privacy.
This started replacing the previous analytics tool, Universal Analytics, on July 1, 2023. They further provided additional time for people to migrate from Universal Analytics to GA4 after the launch.
However, all the new data will go through Google Analytics 4 properties by default.
Why you should begin collecting data with GA4 right away?
If you’re still unsure why to shift to GA4, here is the list of Google Analytics 4 benefits you must know:
Tracks User Journeys
It concentrates primarily on users rather than devices or applications. It tracks and builds a user story or journey based on the relevant operations performed by the user on any device.
New GA4 updates also inform you about the real-time visitor numbers on your website pages. This lets you evaluate their performance quickly.
Focuses on User Engagement
Analyzing the website performance based on the keywords and search results might not have yielded the expected results. User experience extends far beyond demographic metrics.
Hence, the 4th version of Google Analytics uses Artificial Intelligence (AI) to increase user engagement. It provides several options like file download details, outbound click information, etc.
Filters High Engaging Customers
Every organization has a certain target audience but not all users are powerful prospects. The latest Google Analytics tool is built to proficiently target highly engaging customers and facilitate efficient advertisement and campaign analysis.
Simplified Goal Orientation
Every business sets different goals for its marketing team each quarter. Continuously filtering aspects in an analytics tool for every goal can be a cumbersome task.
That’s where GA4—Google Analytics 4—comes in, enabling you to track and analyze behavioral data to develop goals accurately and with ease.
Easy and Upgraded UI
There are a lot of elements modified and added in the latest version to redefine the analytical process. Some of them include the ‘Analysis Hub’, granular data metrics, ‘Demographics’, etc.
Uncompromised Privacy
GA4 also has the additional benefit of enhanced data security. This means it gives you the control to permit only selective personal data of the user, as opposed to the previous versions, where users did not have much control over sharing any information.
How to set up GA4
From the above discussion, if you’re interested in setting up the latest version, here’s how to get started..
If you are new to Google Analytics:
1. Click on the Google Analytics icon on Google Chrome. A window will open. Click on Start measuring.
2. Create an analytics account as an admin.
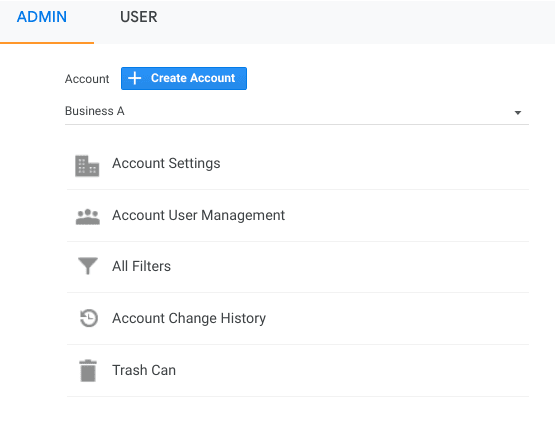
3. Fill in the account name and set up Account Data Sharing Settings. This helps you decide the kind of data you would like to share with Google.
4. Click on Next to create properties. You can add up to 2000 properties in one GA4 account. Add the property name and select the appropriate time zone and currency.
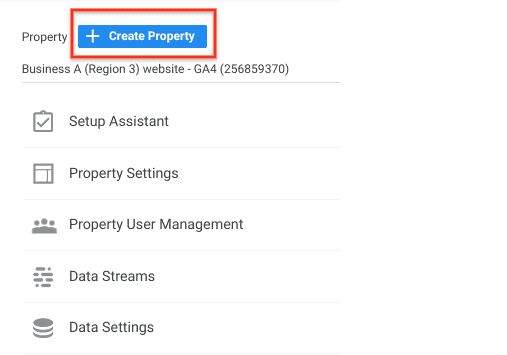
5. Click Next. Select the category of your industry and the size of the business.
6. Go to Data Stream under the property column and select Add Stream. This is the medium for collecting data.

7. Click Create. Accept the “Analytics Terms of Service” and “Data Processing Amendment.”
8. Add the Analytics tag to your web pages for viewing data in your new property. Refer to the section below to learn how to add tags to your web pages.
If you are already using Universal Analytics and want to migrate to GA4:
- Go to the admin page and select the Google Analytics account.
- In the property column, click on the Universal Analytics property account and click on GA4 Setup Assistant.
- Under ‘I want to create a new Google Analytics 4 property’, click Get Started.
- If your site is using/supports gtag.js, you can enable data collection using existing tags.
- If your site does not support gtag.js, you will have to add the tag by yourself. Refer to the below section to know how to add the tags.
- Once you are set with the tags, click Create Property. In this step, all the property details, like name, time zone, currency, etc., will be copied from your existing Universal Analytics property, which activates enhanced measurement events and creates a bridge between Universal Analytics and the GA4 property.
- Once the connection is successful, take note of your GA4 property’s name to use it the next time.
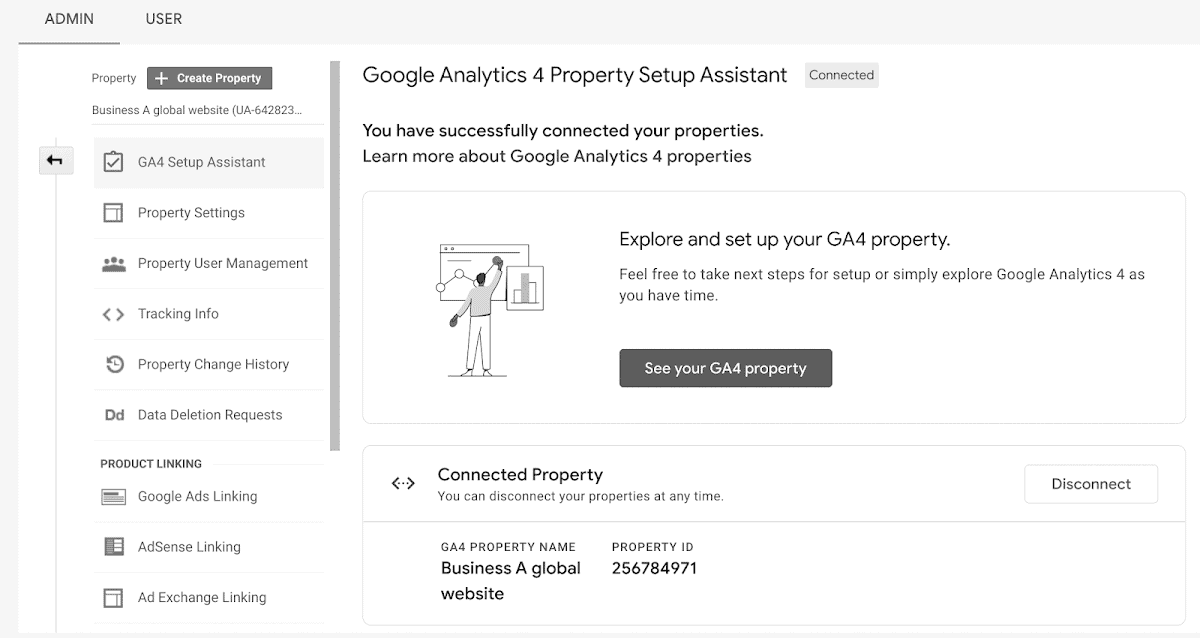
Click here if you want to know which property you are currently using.
How to configure Tag Manager with GA4
Google Tag Manager supports tags with the following combination:
- Google Analytics: GA4 configuration
- Google Analytics: GA4 event
To Add the Google Analytics 4th Version Configuration Tag to Your Web Pages:
- Go to tags and click new. Click tag configuration
- Select Google Analytics: GA4 configuration
- Enter your measurement ID. Optionally:
- You can add other parameters that you think best fits your purpose.
- Add any custom user properties that you want to be configured in user properties.
- Enable triggering to fire GA4 configuration before any other tags.
- When you enable triggering, add the events to cause the tag to fire.
- Save the tag configuration and publish the container.
To Add Latest Version of Google Analytics Event Tag to Your Web Pages:
- Go to tags and click new. Click tag configuration
- Select Google Analytics: GA4 event
- Select the configuration tag you have created. Enter the event name. Here are some recommendations for event names. You can:
- You can add event parameters like parameter name, row, value, etc.
- Customer user properties to configure in user properties.
- Click triggering and choose events that cause the tag to fire.
- Save the tag configuration and publish the container.
Turn on Debug Mode
You can turn on Debug Mode in two simple steps:
- Install Google Analytics debugger chrome extension
- Enable the extension and refresh the page
What are the best ways to use GA4 reports?
Here are the best ways to use ga4 Google Analytics reports:
Realtime report
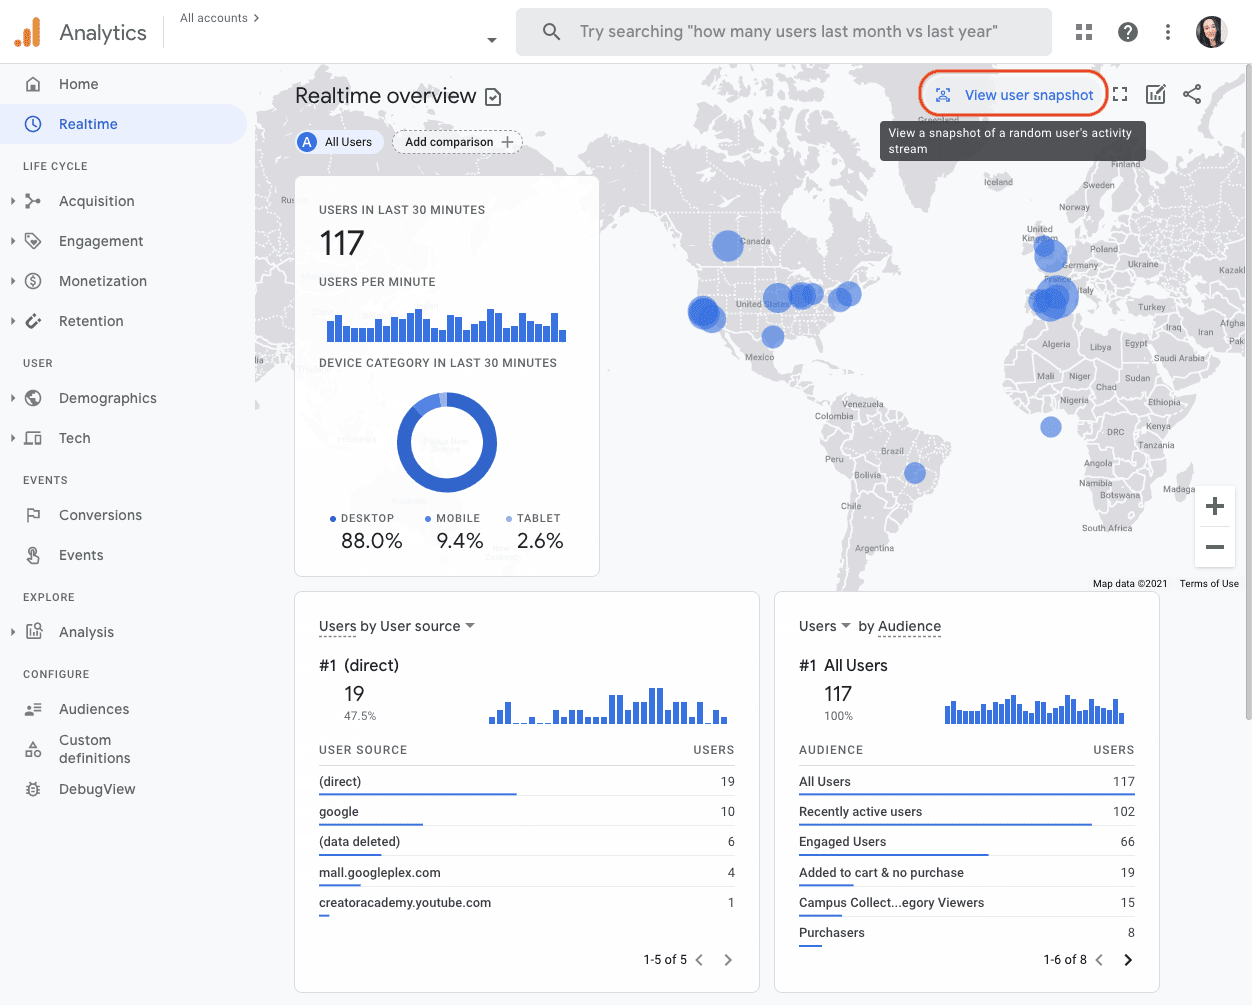
This report shows the real analysis of your website for the past 30 minutes. You can use this to confirm the working of the tracking code, view effects from the YouTube video, and witness new product launches.
Moreover, real-time analysis:
- Lets you know the number of users per page, current website views, etc.
- Allows you to view recent users’ numbers, even those who just visited your website.
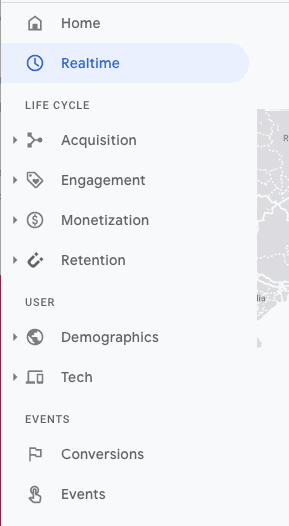
Life Cycle Reporting
This report is a savior for all the marketers out there. You can analyze every step of the conversion funnel and understand customer behavior in the funnel.
Explorer Report
Enter The Analysis Hub—a super-efficient analysis tool that provides several advanced metrics to indulge and understand customer viewpoints.
New analysis you can create on GA4
Here are the steps to create a new analysis:
- Log in to your Google Analytics account and click Analysis.
- Choose the mode to analyze your data. Here are the modes you can choose from:
- Variables column
- Tab Settings column
- Segments
- Dimensions
- Metrics
- Visualization
- Values
- Tabs
- Display
Based on what you select from the above, you can create a new analysis as per your preference.
Explore different types of GA4 analysis
Here are the different types of Analysis:
Exploration
Google Analytics 4 exploration has several new metrics and insights to gather interesting results for understanding your power user’s perspective.
- Google Analytics will now report your cost, impressions, and/or clicks on any combination of the imported required dimensions, providing a more complete and accurate view of your advertising performance.
- View quota log reports to audit problematic users and potentially shut them off.
- Get access to more unsampled data in the interface and through the API.
Funnel Analysis
Marketers can understand user behavior before entering and while in the conversion funnel.
- Identify and fix product disapprovals from Google Merchant Center to ensure your items appear at the top of Google Shopping results and ads, increasing organic traffic and improving sales performance.
- Enable customer match by linking user-provided data collection to personalized ads, ensuring maximum campaign reach and audience coverage.
- The BigQuery export now includes additional session-scoped traffic-source fields, such as cross-channel and other integration-specific contexts.
Path Analysis
Path analysis helps marketers track and understand the customer life cycle. This shall help them to engage customers effectively.
- Recent Google Analytics 4 updates recommend missing or misconfigured app links or universal links to help improve engagement and increase conversions. These recommendations are available if you have an app data stream.
- The new GA4 updates introduce a tag diagnostics tool that helps you fix your website’s tags and ensure accurate data collection. It also identifies issues like tags placed too low on the page or tags that have stopped sending data.
Segment Overlap
This helps marketers create customized segments of their users to understand which segment under their target audience works best for them.
As Google has enhanced the advertising section of Google Analytics 4, marketers can view the number of users eligible for remarketing and ad personalization in Google Ads.
Cohort Analysis
Cohort Analysis is similar to the Segment Overlap except here, the group of similar demographics is added to observe how long it takes for this group to convert to different stages in the funnel.
- Save and edit segments for all users within a property. Marketers can perform from within an exploration or the Segments page in Admin.
Define audience-based conditions through saved comparisons. It enables you to report on your most advanced user segmentations.
User Lifetime
User lifetime helps marketers gather insights on all the driving factors that are helping customers stay for a longer time.
- Access user-related metrics in the user acquisition report and session-related metrics in the traffic acquisition report.
- Mark key events in the events report and gain granular insights through the new transactions report.
Channel Analysis
New updates in Google Analytics enable you to add manual advertising content in marketing ads, allow enhanced data processing, and provide accurate channel reporting.
- Use the manual ad content parameter as a condition group when creating a new custom channel. Channel analysis is no longer limited to using only automatically tagged parameters.
- Gain a clearer picture of marketing performance with improved data attribution to appropriate channels, reducing reliance on direct channels and enhancing channel reporting accuracy.
Business Analysis
‘Key Events’ are crucial events to measure the success of a business. A ‘conversion’ refers to actions that measure your ad campaign’s performance and optimize your bidding strategy.
- Hence, you can view consistent conversion-based performance metrics in both Google Ads and Analytics reports. Benchmarking (comparing your business performance with others) helps you know the strengths and weaknesses of your business, so you can take appropriate actions. Benchmarking data is refreshed every 24 hours.
Other Updates
- Import data from multiple sources and manage it seamlessly without overwriting old data.
- Include Google Marketing Platform (GMP) groups in recipient lists when sending reports via ‘Schedule Email’ or ‘Send Email’ share options.
- Import event metadata through standard fields or custom dimensions and analyze it alongside your existing analytics data.
- Send reports instantly by email.
- View your line chart data organized by day, week, or month.
- Export data directly from a report to Google Sheets.
- Link the DV360 advertiser to export Analytics audiences and conversions to DV360 and access campaign cost and user engagement data in Analytics for better measurement.
- Collect user-provided data even without a user ID.
Conclusion
Irrespective of the size of the businesses, every organization is looking to increase its ROI. Currently, two factors can work best: Data and Digital.
Hence, GA4 entered at the right time, and by the looks of it, it has already started entering the right places as well.
- Google Analytics eCommerce: All the e-Commerce Tracking Problems & How to Fix Them
- WooCommerce Google Analytics: How to set it up easily and quickly?
- Best WooCommerce Google Analytics Plugins (2023)
- How to set up and monitor multiple Google Analytics accounts from a single place [Complete guide]
- Shopify Google Analytics 2023: Step-by-step Guide
