Hey there, website owners!
Are you struggling to track your website traffic and figure out how to improve your website’s performance? We get it, web analytics can be overwhelming and confusing, especially for those who aren’t tech-savvy.
But don’t worry, there’s a solution that can help you out.
Enter Putler Web Analytics – a simple yet powerful analytics tool that provides accurate data to help you make informed decisions for your website.
Unlike other analytics tools that can be confusing, Putler Web Analytics has a user-friendly interface that makes it easy for anyone to navigate and understand their website’s performance.
let’s first learn about web analytics and how tracking the right analytics can help your business like never before.
If you wish to skip all the theory and go straight into Putler Web Analytics, click here.
What is web analytics?
Web analytics is all about collecting and analyzing data related to your website traffic to gain valuable insights into how your customers are engaging with your business online. It might sound complicated, but it’s actually pretty simple.
Speaking of web analytics tools, they help businesses gain valuable insights into their website visitors, including behavior, traffic sources, page views, and bounce rates.
These insights help businesses understand their audience and improve online operations by making data-driven decisions to optimize their online presence for better engagement and conversions, resulting in improved customer relationships and growth opportunities.
Why web analytics?
If you’re running a website or an online business, you probably already know how crucial it is to understand your customers and their behavior.
And that’s where web analytics comes in.
It’s like having a secret weapon that provides valuable insights into your website’s performance and how your customers are engaging with it.
So, let’s dive deeper into why web analytics is important and how it can help you grow your business online.
Better understanding of the target audience
Website analytic tool provides a closer look at your website visitors, including details like age range, demography, etc. This helps businesses to take a deeper look at their target audience and understand their requirements in a better way.
Assists in website & search engine optimization
Web analytics identifies loose ends and loopholes in your website that are causing disruptions for your business. You can accordingly optimize your website and keywords for a better ranking on the search engine.
Measure Website Conversions
Using a simple web analytics tool, you can measure users’ desired actions on your website, like filling out a contact form or making a purchase. You can also see the “ user’s conversion path,” meaning the activities your users took on the site before they converted, and help you gain insights into the percentage of conversion, the amount earned from the conversions, and the abandonment rate.
Insights on top-performing content
Web analytics tools also help you understand which content is performing the best on your website by gathering information from different data points. Based on the current website’s overall behavior and the target audience’s interest, the website analytics tools suggest you focus on the content that helps you achieve the business goals.
Understand and optimize referral sources
With website analytics tools, you can understand more about your top referral sources and your site’s external links that people are clicking on, and therefore, you can optimize your site and focus on that channel. For example, half of your web analytics traffic is from Facebook, you can invest in ads on that platform.
Key web analytics metrics to track your business success
Measuring and analyzing data related to your website traffic can help you gain insights into how your audience is engaging with your business and take steps to optimize your online presence for better engagement and conversions.
So, let’s explore some of the key web analytics metrics that you should track to ensure the success of your online business.
Bounce Rate
This is the time your audience spends on a particular page of your website. It gives insights into what type of pages or content the audience is interested in.
Traffic source
This gives information about different sources or mediums the target audience is entering your website. These sources can be social media, search engines, paid marketing, etc.
Conversion Rate
This is the percentage of the people who enter your website and perform a specific action benefitting your business. It can be subscribing to your emails, purchasing a product, etc.
Average time on page
This is the time your audience spends on a particular page of your website. It gives insights about what type of pages or content the audience is interested in.
Exit page
This provides insights on which page the audience is exiting from your website. This is especially useful for those websites that have content-heavy pages and helps simplify the entire process of customers entering the website to make a purchase.
Issues with Web Analytics
While the website analytics tool provides many insights into enhancing the website experience, here are the details of what web analytics cannot do:
Action to take after the audience visits the website
Web analytics provides you with all the data about your audience, but it doesn’t give you any insights on what action to take after the audience visits your website. This information can be deduced with additional analytical actions like targeted email campaigns, surveys, etc.
Tracking metrics
Web analytics have way too many metrics and complex factors to understand the analysis. Keeping constant track of all of these metrics is a daunting feat.
Data inaccuracy and risk
Due to a lot of inflow of data, sometimes, you cannot be completely sure of the accuracy and they may be susceptible to risks.
Converting data to information
Web analytics can only provide you data via all the data points. However, this is not sufficient to understand your business’ performance. You need an additional tool to process this data and provide helpful information.
Lack of eCommerce tracking metrics
There are a lot of website analytics tools available in the market, but not most of them support eCommerce tracking KPIs like shopping cart abandonment rate, average order value, total sales, or new vs. returning customers. So, if you’re running an eCommerce business, a web analytics tool may not be your perfect partner to get in-depth eCommerce analytics & reports on sales, orders, products, customers & visitors to boost revenue.
Google Analytics – The good, bad and ugly
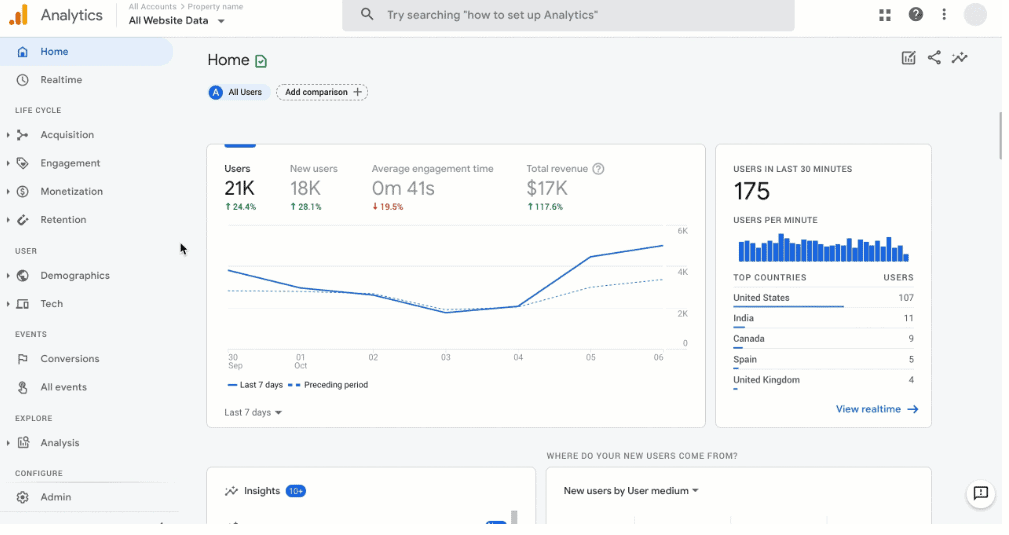
The most commonly used web traffic analytic tool by most organizations is Google Analytics. Here are the reasons:
- It is free of cost.
- It collects data automatically
- It provides reports of your website, and you can customize it
- It is compatible with other tools and platforms hence you can easily integrate
- It provides information about target social media platforms, content, etc.
Although Google’s web analytics is a well-known tool, it requires education, because
Clustered information
Google Analytics finds a lot of data, and some are irrelevant. With such heavy data, it becomes difficult to filter the relevant data from the cluster.
Incomplete information
There are different ways to opt out of Google Analytics, like not allowing cookies or turning off JavaScript. Hence chances are the information provided by the tool may be incomplete.
Complicated setup for some metric tracking
While there are many factors that Google automatically tracks, for some of them, you may have to manually set up the tracking system. This is an elaborate and difficult process.
Problems with GA4 development
With GA4’s recent developments, however, many questions remain unanswered.
- No data migration from Universal Analytics
- Inaccurate eCommerce revenue tracking
- Data privacy concerns
- Complex UI interface, and a lot more.
As a result, it allows you to make bad decisions and lose opportunities.
Putler Web Analytics – An alternative to Google Analytics
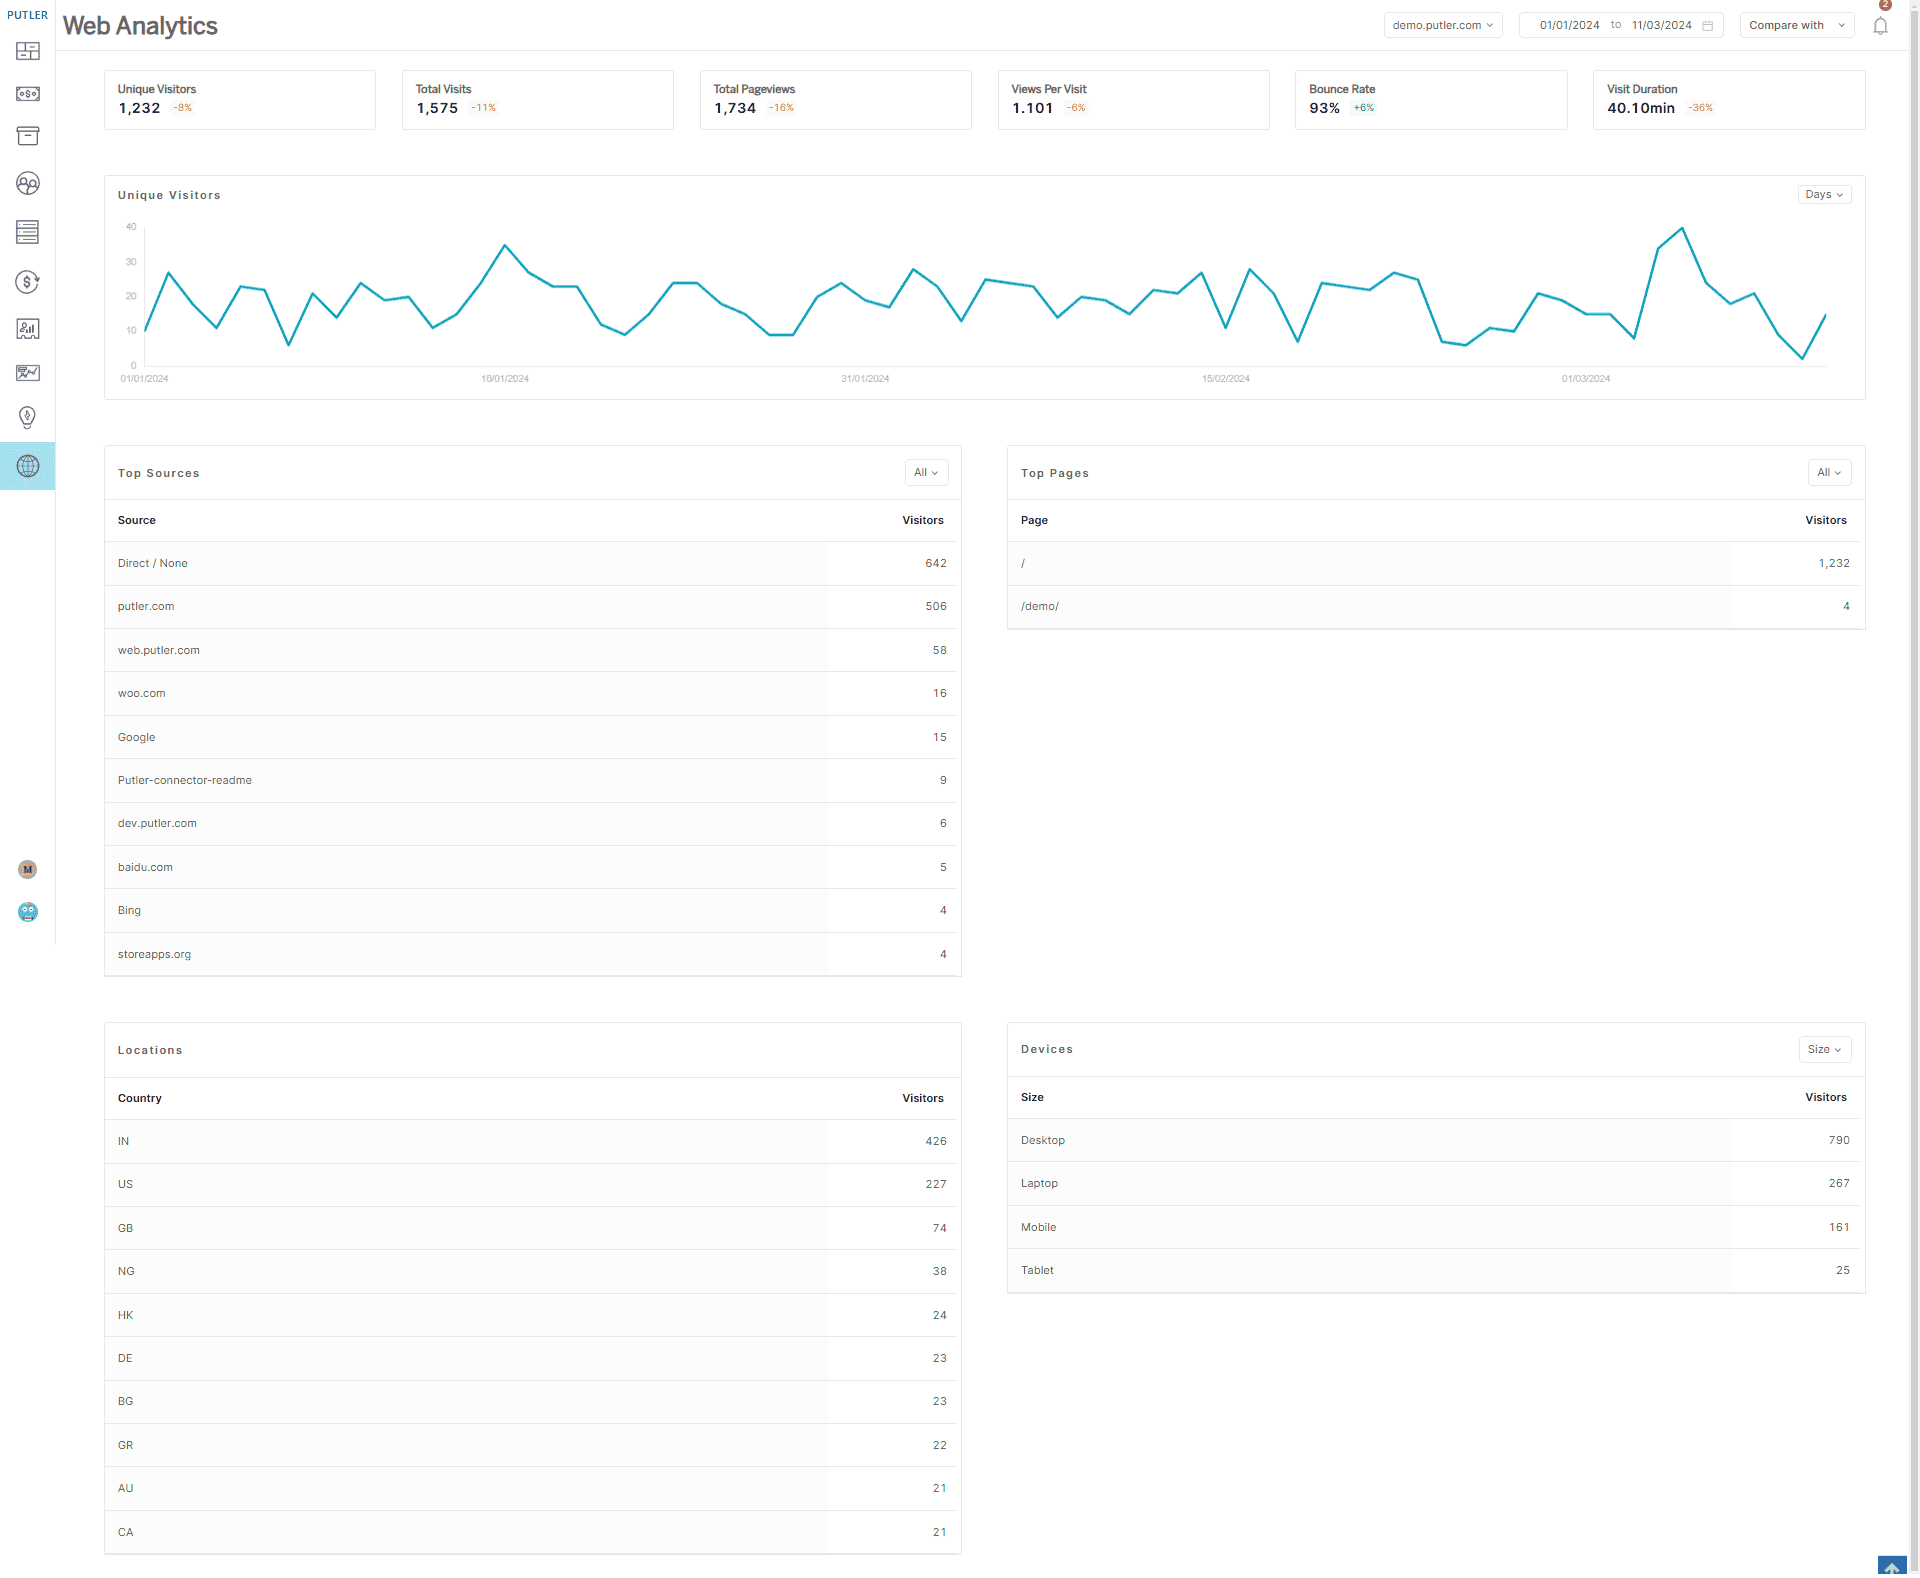
Putler Web Analytics is a simple and lightweight web analytics tool that respects your privacy.
This tool can help you identify areas for improvement on your website with valuable actionable growth insights, track your traffic sources and engagement, and optimize your website’s conversion rate.
And, the best part is, Putler Web Analytics does not stack your dashboard up with an overwhelming amount of data, the way other web analytics tools do.
Instead, this simple web analytics tool helps you get only the most important data that are relevant to your website’s performance and can help you optimize your website for better user engagement and revenue growth.
This means you won’t have to sift through pages of irrelevant data to find what you’re looking for.
Putler Web Analytics – Live Demo
Why is Putler Web Analytics better than Google Analytics?
Discover your top funnel
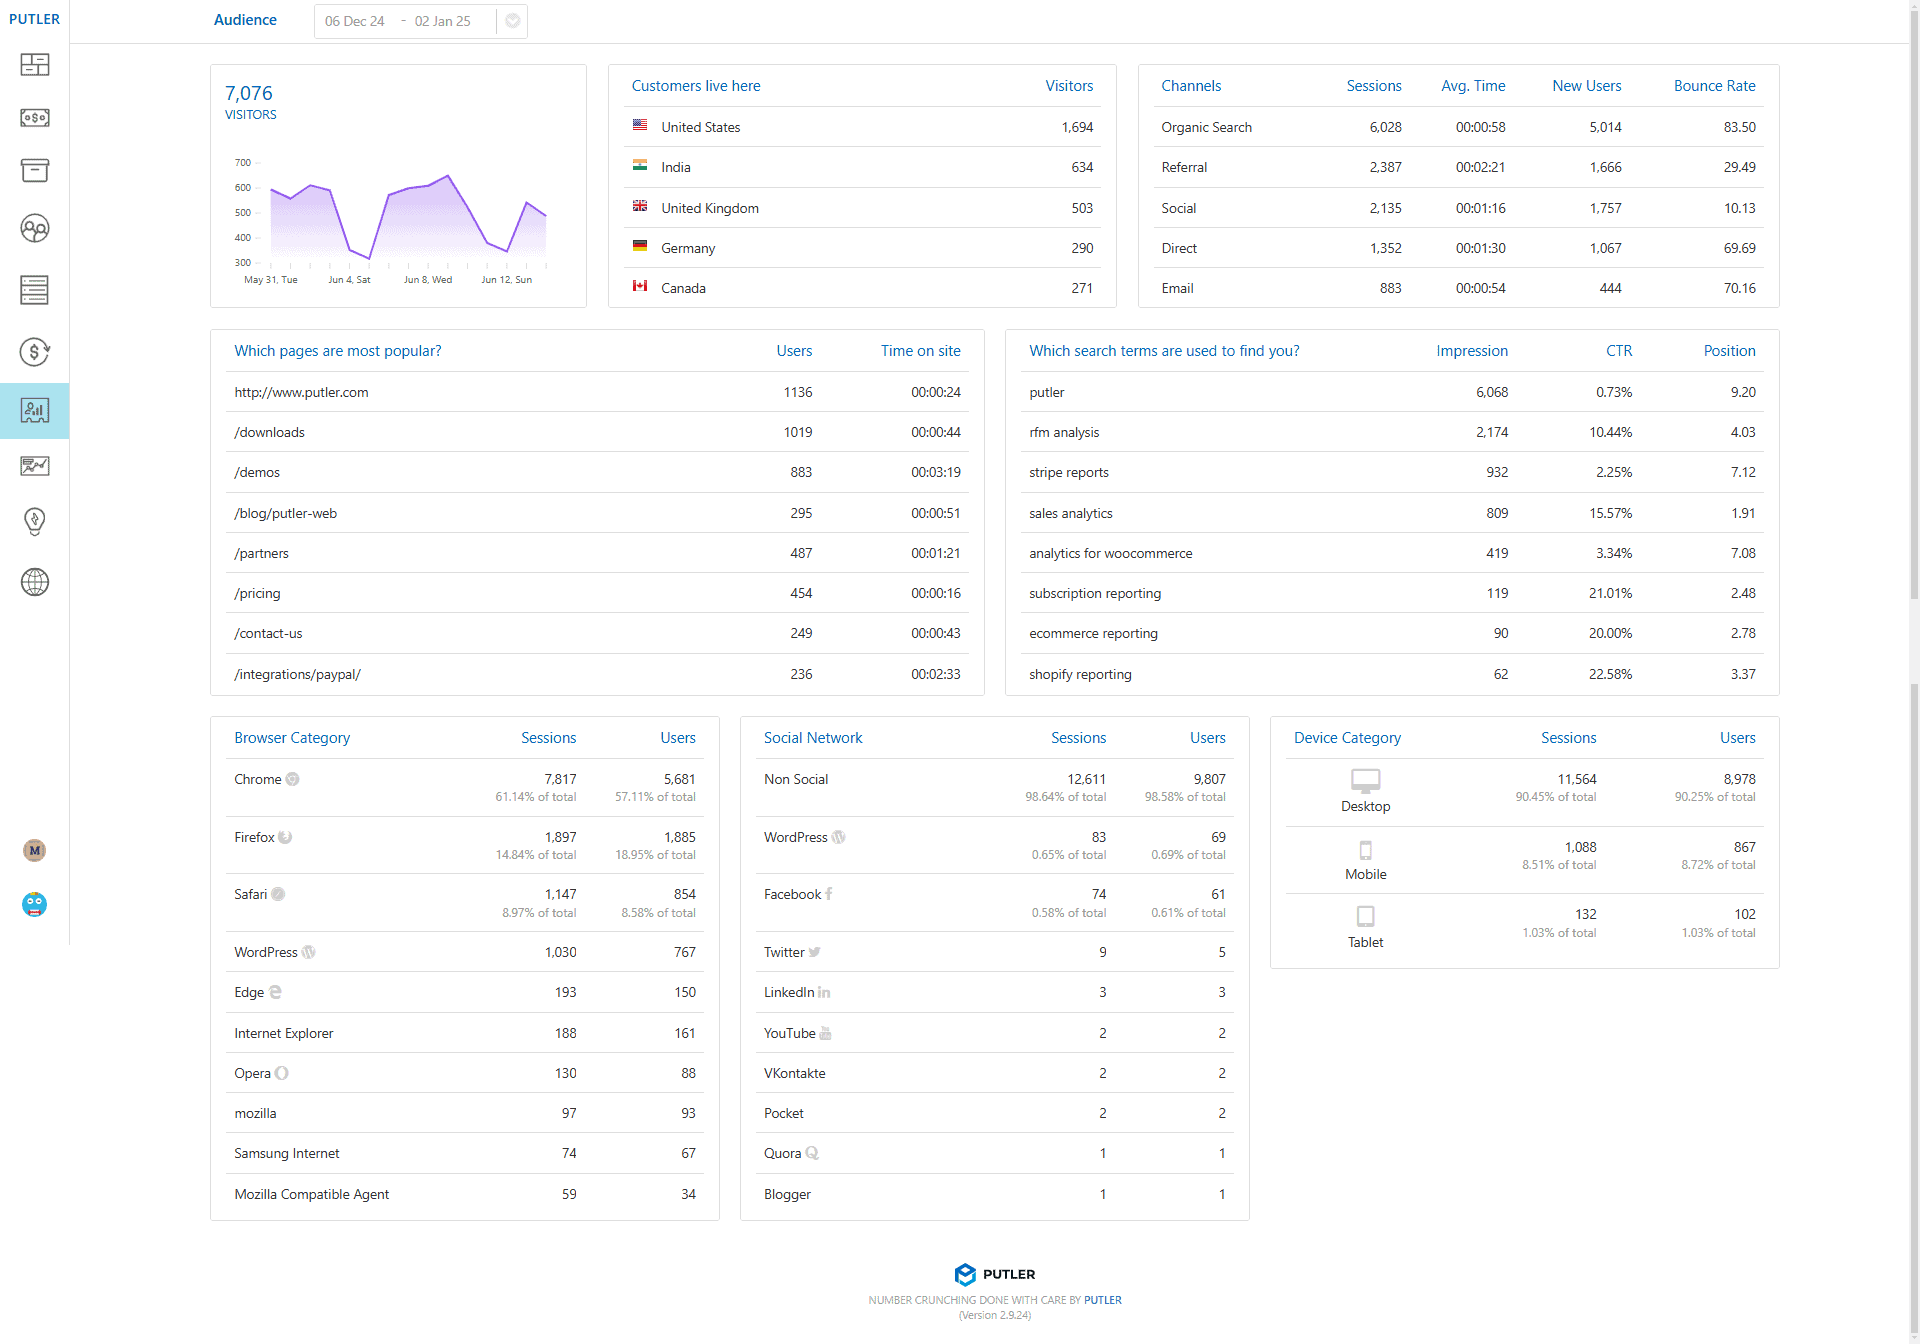
Putler Web Analytics offers a comprehensive dashboard that gathers all of your website’s data in one place, including top-performing pages, popular demographics, traffic sources, and device usage. This helps identify areas for improvement and make data-driven decisions to optimize your website’s performance and improve user engagement.
Easy report customization
Customize your web analytics reports quickly and easily with Putler’s user-friendly dashboard. Adjust parameters such as countries, pages, and goals to generate insightful reports that help you make informed decisions to improve your website’s engagement and conversions.
Link tracking accuracy
Putler Web Analytics’ UTM, source, and medium tracking ensure accurate link tracking, providing businesses with comprehensive information on visitor behavior and demographics. This simple web analytics tool helps users to optimize their websites and streamline marketing efforts for better engagement and conversions.
Easy view metrics
Putler’s web analytics tool presents multiple data points in one place, including unique visitors, page views, duration, and bounce rate. It offers a streamlined approach to web analytics, providing businesses with a comprehensive understanding of their website’s performance.
There are also other ways in which Putler Web Analytics is a more simple web page analytics solution
Lightweight script that doesn’t impact your website speed
While other analytics scripts have a performance impact on the page weight and the website loading speed. With Putler, you’ll get all the essential insights into your website traffic analytics without affecting your site’s speed.
A simple web analytics tool without privacy invasion
Putler Web Analytics is committed to privacy and does not use cookies or track and collect personal data. This approach ensures that user data remains secure and protected, providing businesses with reliable analytics without any privacy invasion.
User-friendly web experience
Putler Web Analytics offers a seamless user experience without any annoyances or distractions. This feature ensures that users can navigate the website without compromising on ease of use or website performance.
Easy to set up and integrate into your website
No matter which CMS you use or how you’ve created your website, Putler is a simple analytics tool to set up and integrate into your website.
Ready to take control of your web analytics? Get started in minutes with Putler. Simply insert the code emailed to you in the head tag of your website. Next, open Putler > Web Analytics dashboard, and you’re done to improve and optimize your future efforts.
Not just website analytics, Putler provides you eCommerce tracking too!
Yes! Putler offers an incredibly intuitive and comprehensive data analytics dashboard that provides valuable insights and reports on a wide range of metrics, including – Sales, Products, Customers, Orders, Transactions, Subscriptions, and Website Audience.
Key metrics you can measure from different dashboards of Putler
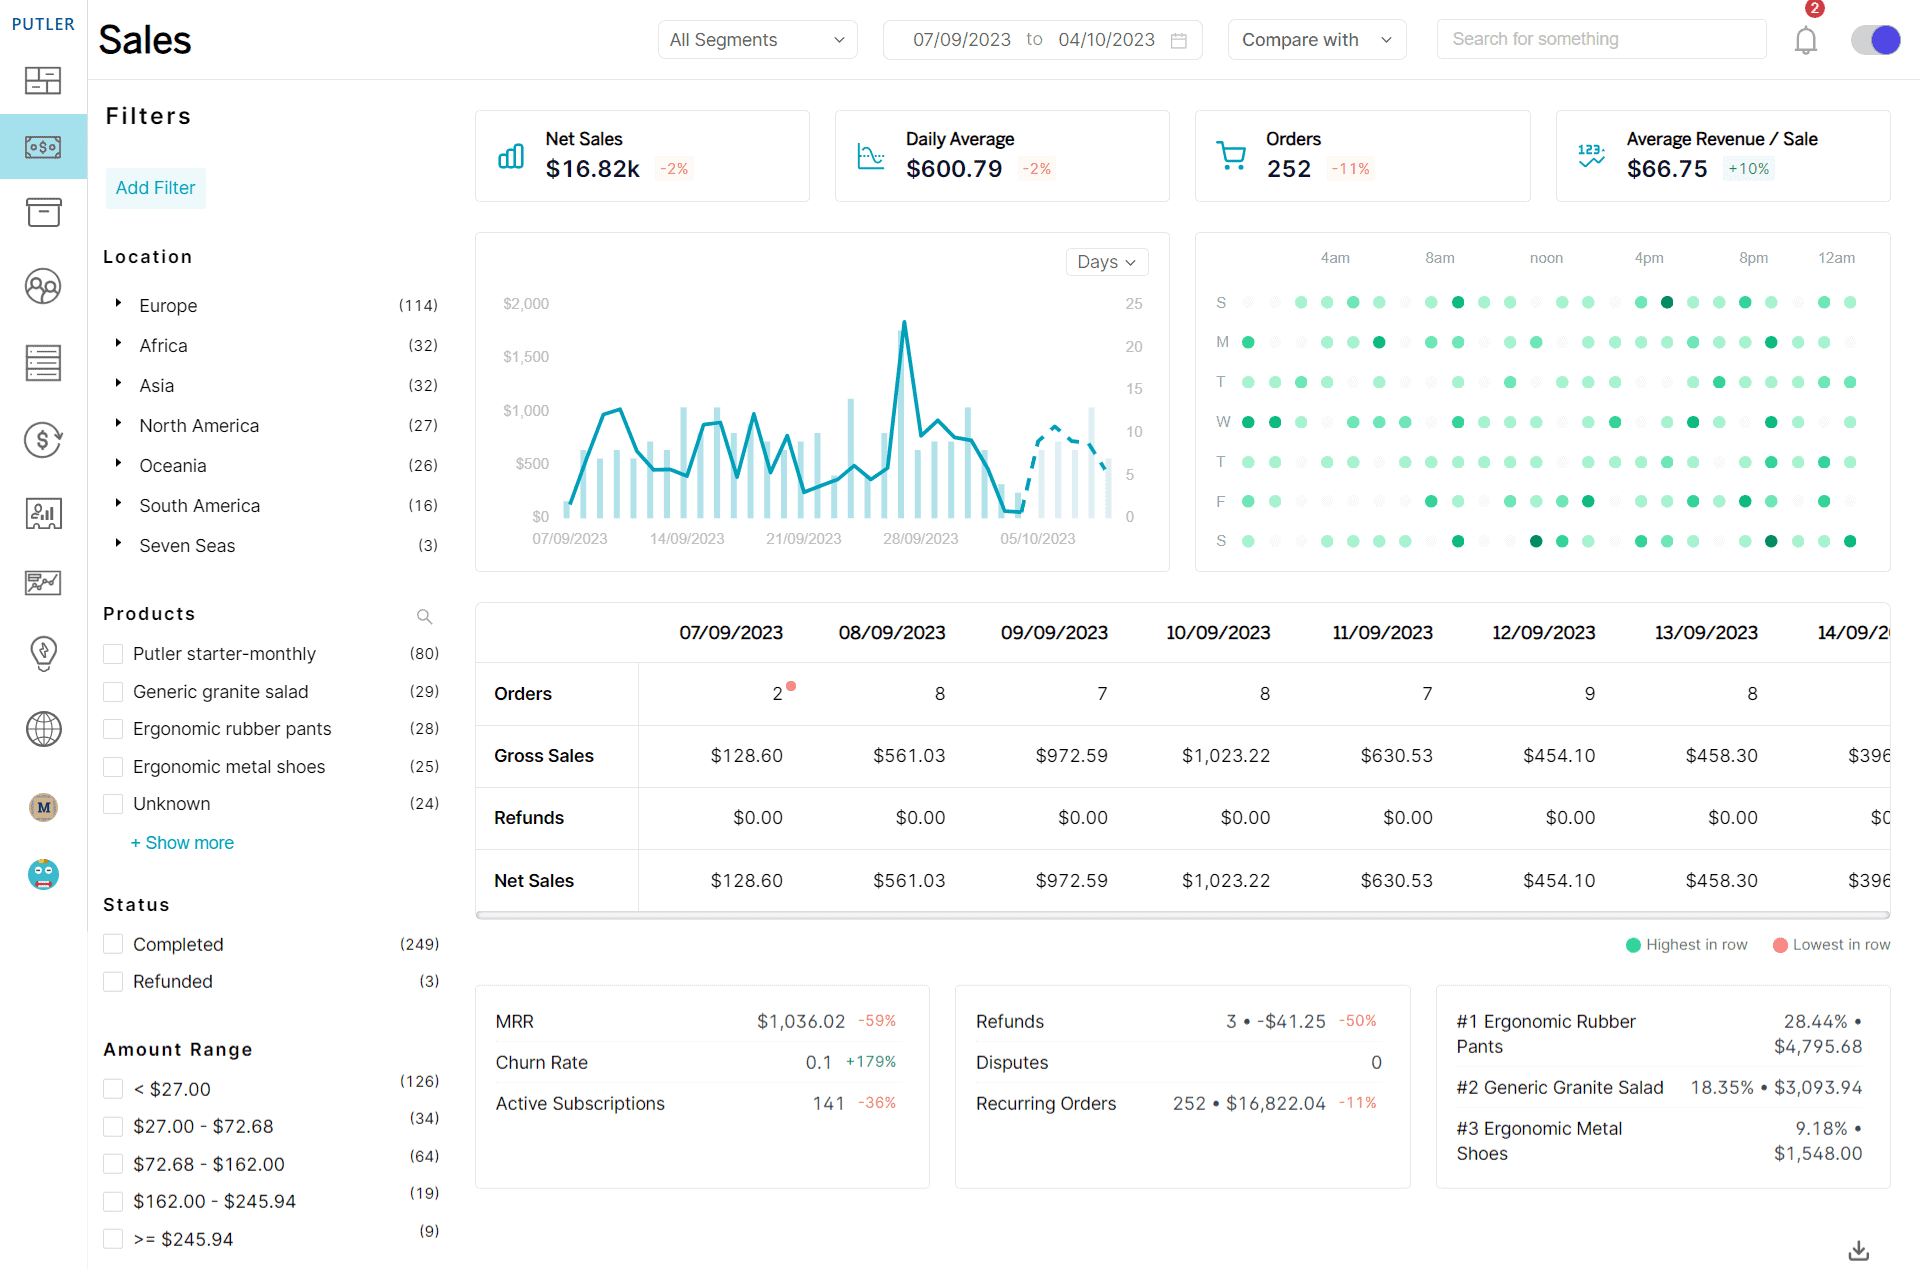
Sales Dashboard
You can track net sales, daily average sales, orders, and average revenue/sales.
Products Dashboard
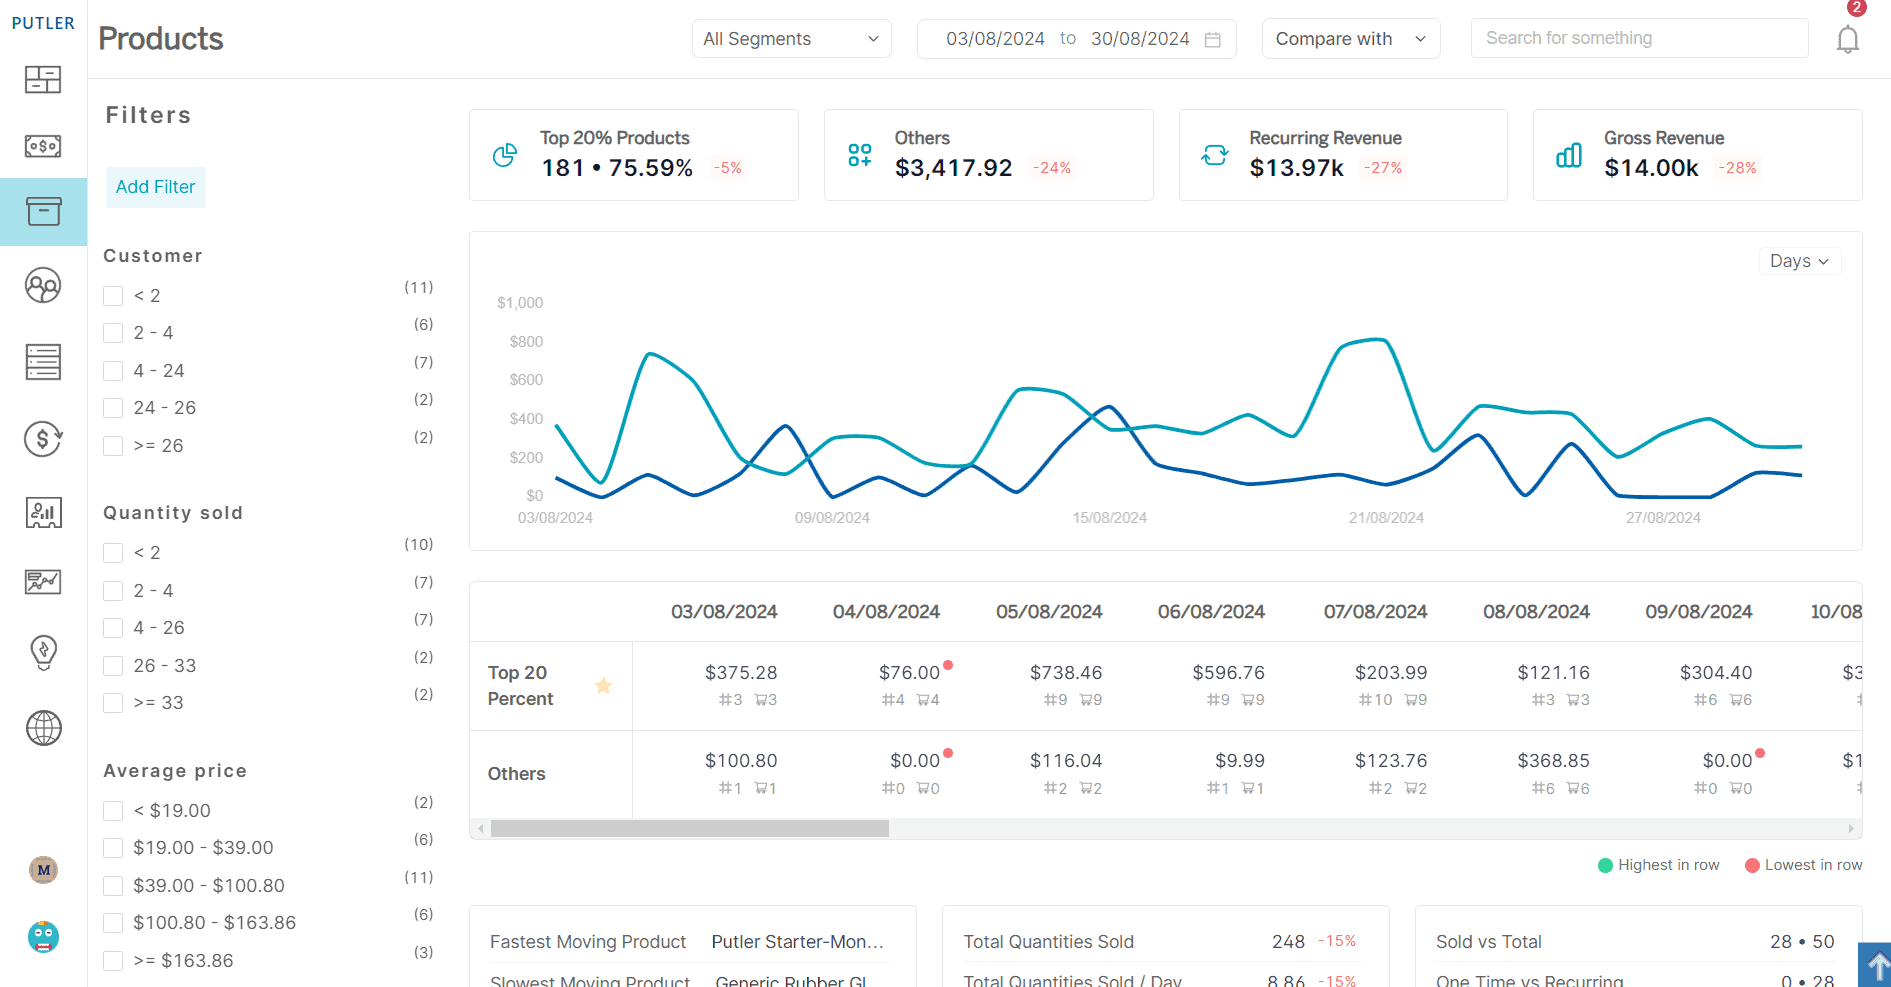
With Putler’s Products dashboard, you can track the gross/recurring revenue for specific products and the top 20% of products using filters.
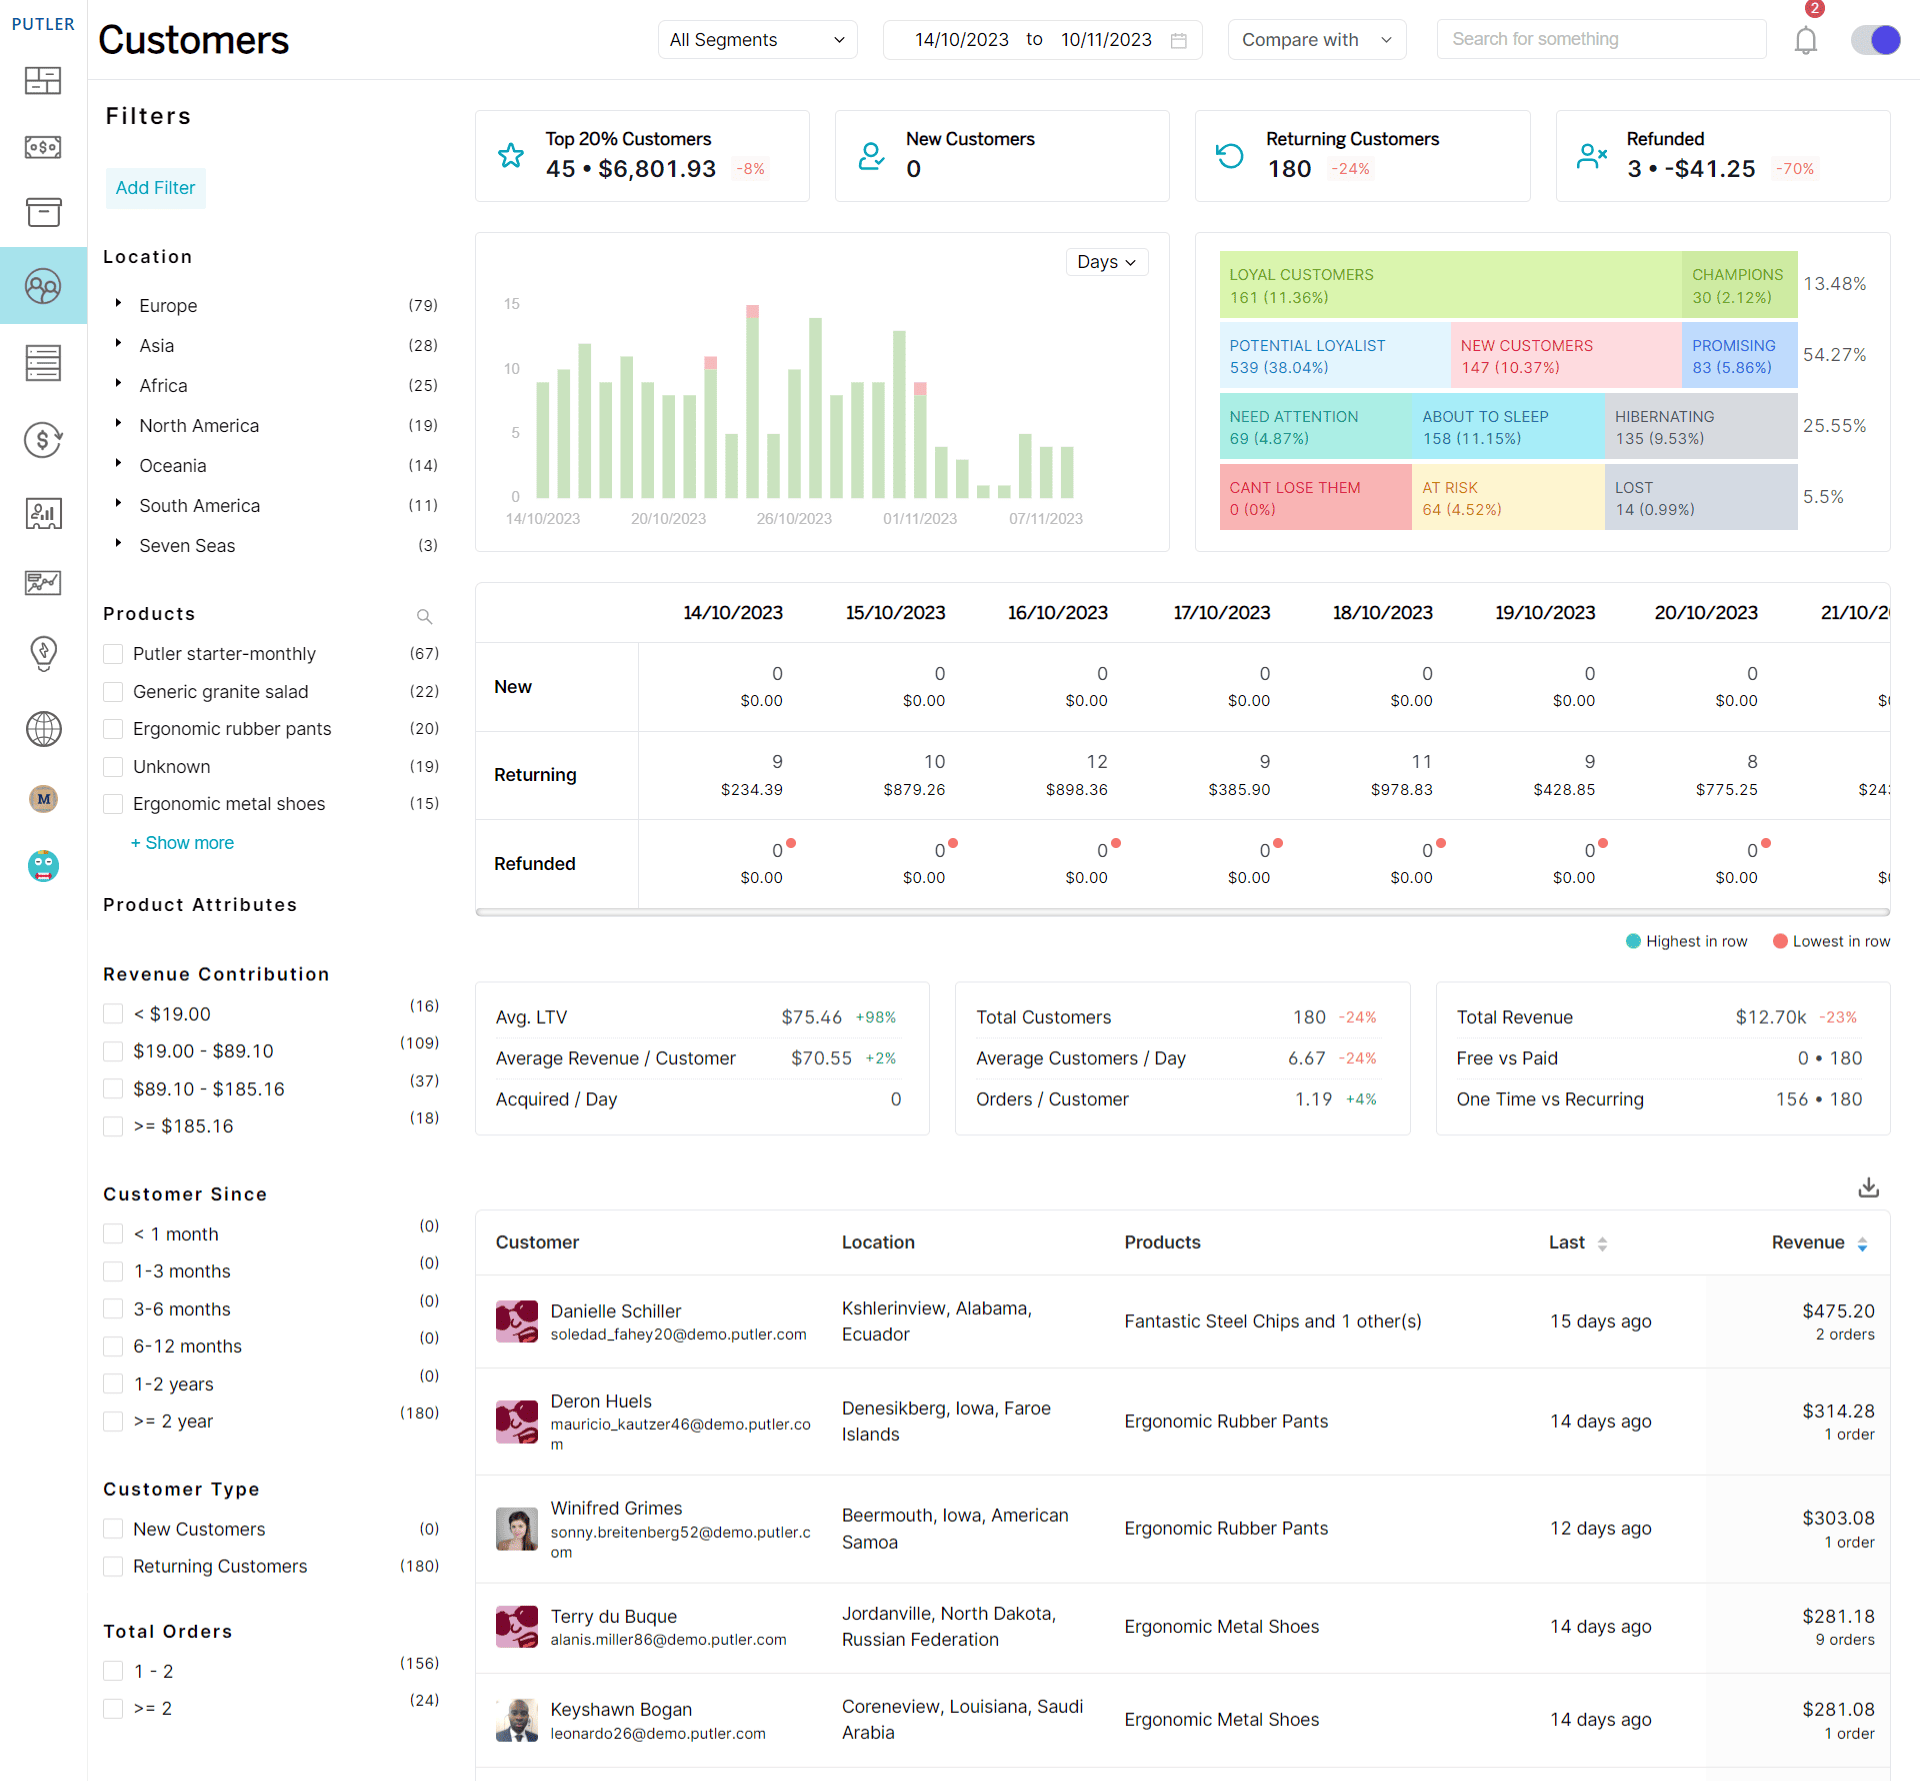
Customers Dashboard
Understand new vs returning customers, identify the top 20% of customers, refunds, revenues, and disputes raised by customers.
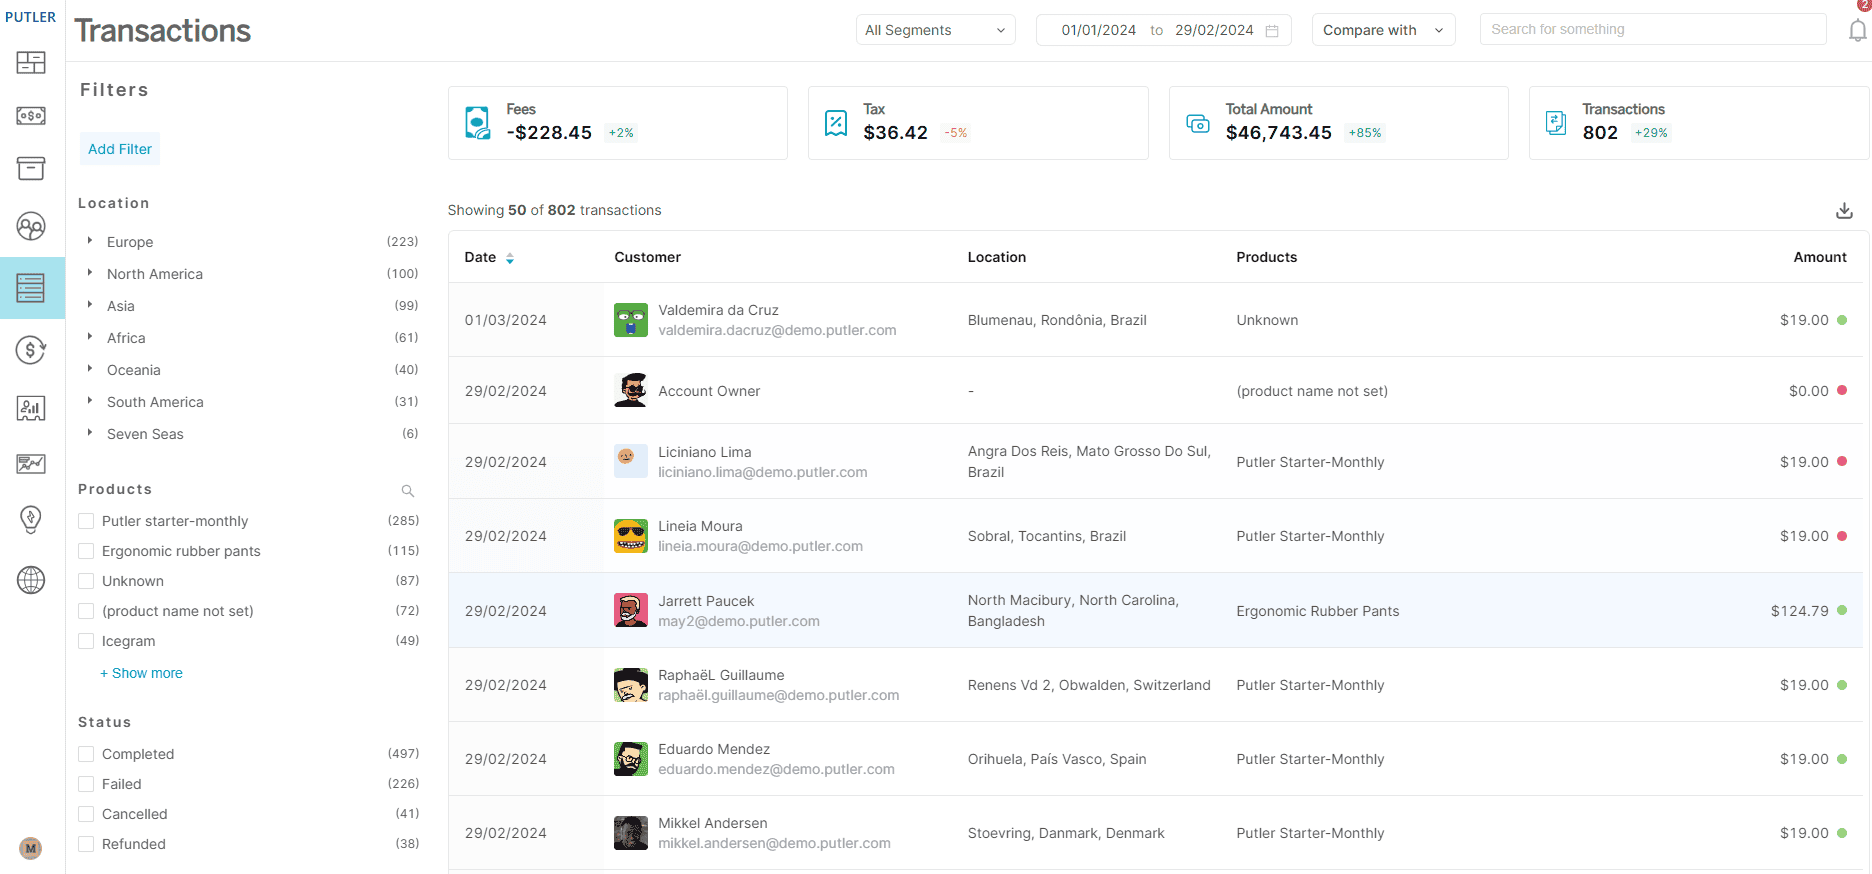
Transactions Dashboard
From the Transactions dashboard, you can track fees, tax, total amount, and transactions that occurred for the specific product/ location. Also the status of the transaction.
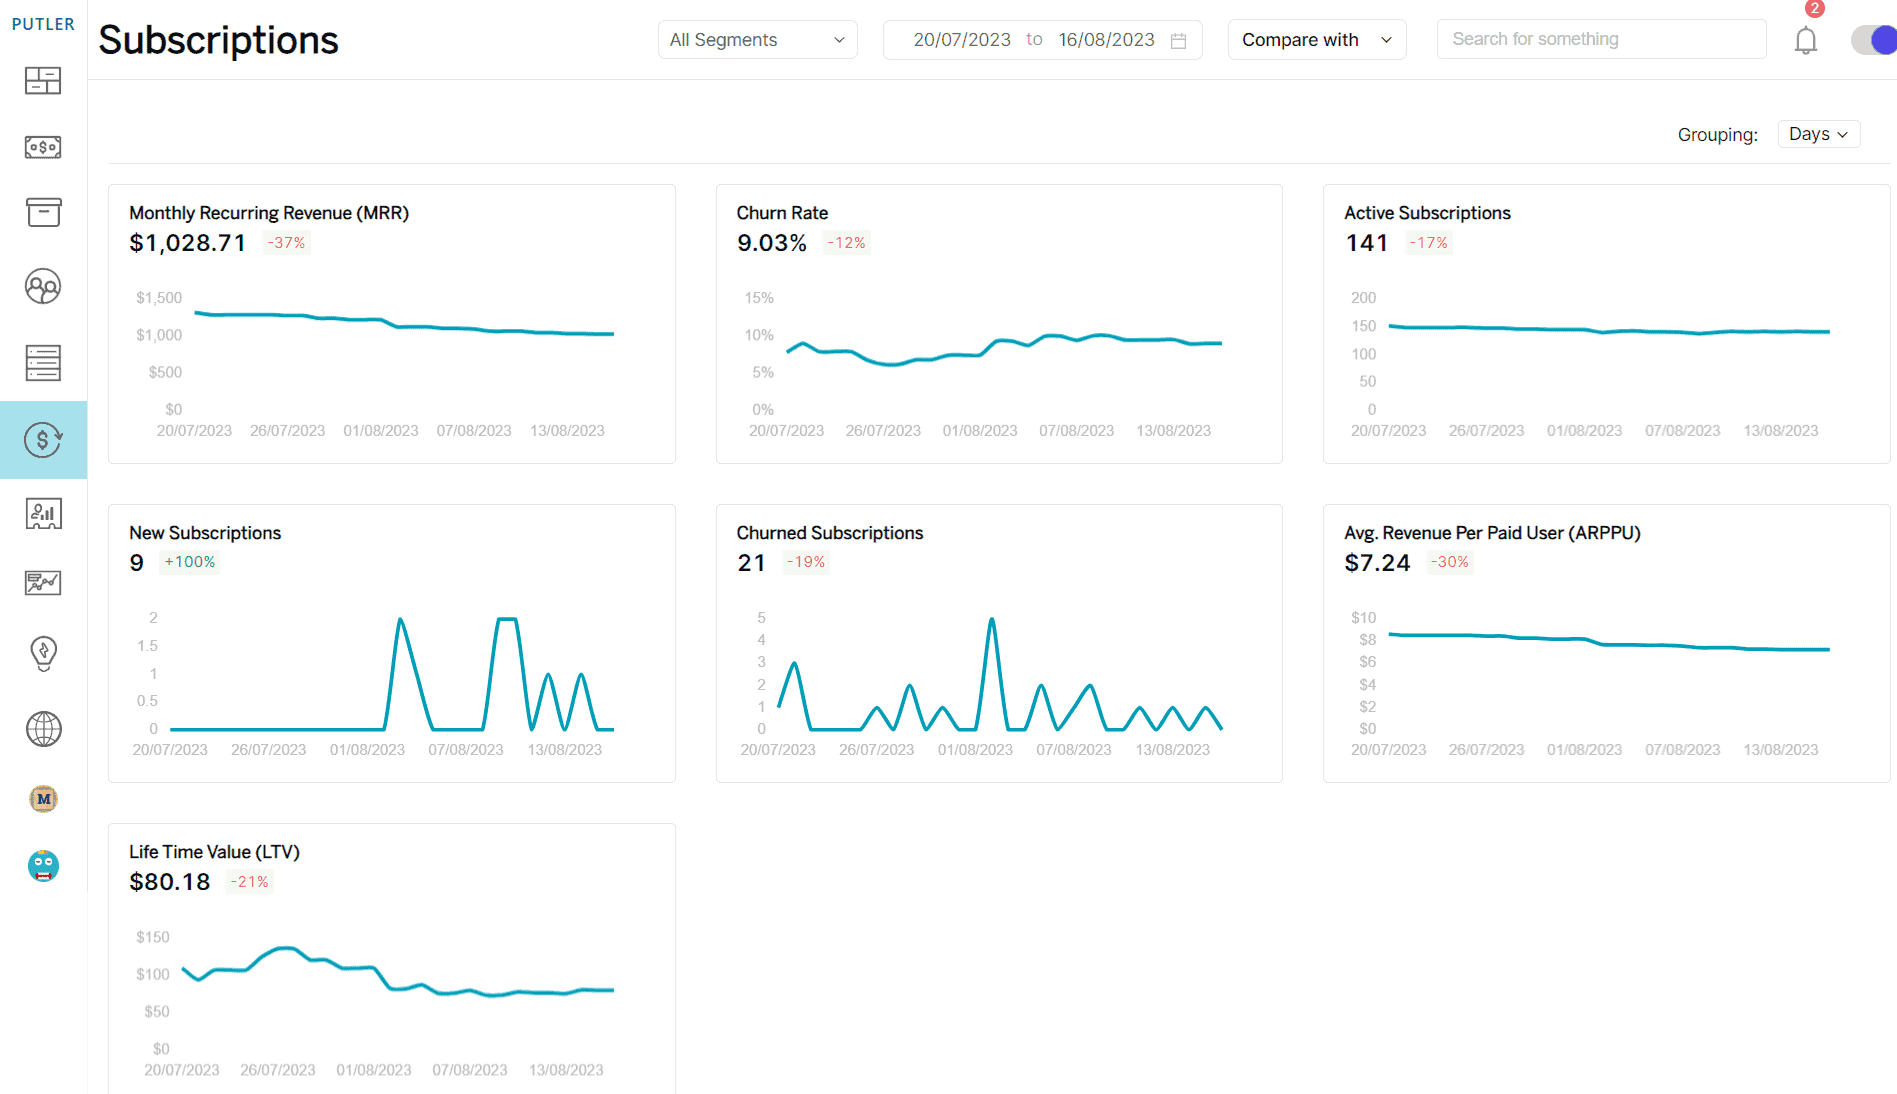
Subscriptions Dashboard
You can track SaaS KPIs like new subscriptions, ARPU (average revenue per user), ARPPU (average revenue per paid user), ARR (annual recurring revenue), MRR (monthly recurring revenue), Churn, and LTV (lifetime value).
Website Audience Dashboard
With this dashboard, you can measure key website audience metrics like the number of visitors, average time spent, session used, new users, bounce rate, impressions, position, CTR(Clickthrough Rate), and so on to boost sales.
Roadmap of the future endeavors with Putler Web Analytics
Putler Web Analytics is designed to provide website owners with accurate, easy-to-understand website analytics and reports. Our goal is to deliver comprehensive insights combining eCommerce tracking and visitor tracking in a single platform.
We aim to address challenges like inaccurate tracking, improper attribution, issues with Google Analytics migration, and more.
If you are a new user, go sign up for a 14-day free trial and start using Putler Web Analytics now.
