Are you running a WooCommerce store but feel like you’re not reaching your full potential? You’re not alone. Many store owners are leaving money on the table simply because they lack the right insights.
Here’s a surprising fact: Around 12,639 WooCommerce websites currently have more than $100,000 in sales revenue. That’s right – your store could be one of them.
So what’s the secret ingredient these successful stores have? Advanced WooCommerce reporting. Many store owners are still relying on basic metrics, missing out on the powerful insights that advanced reports can provide.
In this post, we’ll explore how WooCommerce advanced reports can transform your business. Whether you’re just starting out or looking to take your established store to the next level, this guide will give you the tools you need to join the ranks of top-performing WooCommerce stores.
WooCommerce’s built-in reports: What you’re missing out on
WooCommerce provides built-in reporting tools that give store owners insights into their store’s performance. These reports are divided into four main sections: Orders, Customers, Stock, and Taxes.
Orders Reports
Sales by Date
- Displays gross and net sales volume and totals.
- Shows a graph with gross sales, net sales, shipping amount, refunds, and coupon values.
- Allows filtering by year, last month, this month, last 7 days, or custom date range.
Sales by Product
- Shows sales per day for specific products.
- Allows selection of individual products for detailed analysis.
Sales by Category
- Displays sales numbers for selected categories.
- Enables comparison across different product categories.
Coupons by Date
- Shows total discounts and number of coupons used.
- Allows filtering by coupon and viewing most popular coupons.
Customer Downloads
- Tracks downloaded products with unique IDs.
- Shows download date, product, file name, order, and customer location.
Customer Reports
- Customers vs Guests: Compares registered customers to guest checkouts.
- Customer List: Displays information about registered users only.
Stock Reports
- Lists low-in-stock items.
- Shows out-of-stock items.
- Displays most stocked products.
Tax Reports
- Taxes by Code (State): Breaks down tax collection by state or region.
- Taxes by Date: Shows tax collection over periods.
Now, let’s explore the limitations of these reports and understand why the need for WooCommerce advanced reports arises.
Disadvantages of WooCommerce’s built-in reports:
- These reports only display data from WooCommerce itself, excluding any information from other tools or platforms you use.
- They offer limited insights into customer behavior and do not assist in categorizing customers effectively.
- Sales data can only be filtered by year, month, or custom date range, restricting the analysis of sales trends.
- Customer information is basic and lacks important details such as location, contact information, purchase history, total spending, and overall value to your business.
- If you sell subscriptions, these reports do not provide specific information necessary for subscription management.
- There is no feature for predicting future sales or revenue.
- They do not provide insights into your website audience or their interests.
- The reports do not update in real-time, and setting up alerts for important changes is not possible.
- Customization options for the reports are limited.
- Product performance analysis is rudimentary and does not offer advanced insights such as product correlations or strategies to boost customer spending.
These limitations can make it hard to fully understand your business. This is why WooCommerce advanced reports are important—they help you make better decisions to grow your store.
Why your WooCommerce store needs better insights
Here are some practical disadvantages your store may face, causing it to fall behind the competition without advanced reporting.
- Lacking comprehensive data makes it challenging to roll out effective loyalty programs that reward top customers.
- Missed opportunities for upselling and cross-selling could increase average order values if better insights were available.
- A lack of detailed product insights can pose a high risk of mispricing products.
- Inadequate customer data makes identifying and retaining at-risk customers difficult, potentially letting them slip away unnoticed.
- A lack of accurate insights hinder the identification of new product opportunities or discovery of market segments.
- The inability to quickly identify and resolve bottlenecks using insightful data can delay the resolution of operational issues.
- Without accurate forecasting, growth planning gets hindered, emphasizing the need for reliable data.
- Basic customer purchase pattern insights become a roadblock in offering personalized recommendations and improving customer satisfaction.
- A lack of clear marketing insights make it difficult to distinguish effective marketing efforts from those that do not drive sales.
- Inaccurate demand predictions lead to inventory imbalances, requiring better insight into customer needs and market trends.
15 must-have WooCommerce advanced reports
Here are 15 must-have WooCommerce advanced reports you should be tracking.
Sales by country
What it is: This report breaks down your sales data by the countries where your customers are located.
Benefits: It helps you understand your international market presence and identify strong and weak markets.
Example: You might discover that 40% of your sales come from Canada, suggesting an opportunity to focus more marketing efforts there or explore similar markets.
Product performance
What it is: A detailed analysis of how each product in your store is performing in terms of sales, revenue, and profitability.
Benefits: Helps you identify your best and worst-selling products, allowing you to make informed decisions about inventory and marketing.
Example: You might find that your handmade soap is outselling your candles by 3 to 1, prompting you to increase soap production and consider expanding your soap line.
Customer segments
What it is: This report groups your customers based on shared characteristics like purchase behavior, demographics, or loyalty.
Benefits: Allows for more targeted marketing and personalized customer experiences.
Example: You might identify a segment of customers who consistently buy during sales, allowing you to create special promotions just for this group.
Customer history
What it is: A comprehensive view of each customer’s interactions with your store, including past purchases, browsing behavior, and support interactions.
Benefits: Enables personalized customer service and helps identify upsell or cross-sell opportunities.
Example: You notice a customer regularly buys running shoes every 6 months, so you set up a reminder to send them a discount code just before their next likely purchase.
Order stats
What it is: An overview of your order trends, including average order value, order frequency, and peak ordering times.
Benefits: Helps with inventory planning, staffing decisions, and identifying opportunities to increase sales.
Example: You might discover that your orders spike every Friday evening, prompting you to ensure you’re well-stocked and fully staffed at these times.
Tax reports
What it is: Detailed breakdowns of the taxes collected on your sales, often categorized by region or product type.
Benefits: Simplifies tax compliance and helps with financial planning.
Example: You can easily see that you collected $5,000 in sales tax from the state of New York last quarter, making it simple to file your tax returns accurately.
Country-based sales
What it is: A more detailed version of sales by country, often including information about popular products, average order values, and return rates for each country.
Benefits: Helps tailor your international strategies and identify country-specific trends or issues.
Example: Notice that customers in Australia have a higher average order value but also a higher return rate, prompting you to investigate the cause.
Refund tracking
What it is: A report that monitors the frequency, reasons, and patterns of product returns and refunds.
Benefits: Helps identify product quality issues, unclear descriptions, or other problems leading to returns.
Example: Notice a spike in returns for a particular shirt size, leading you to check if there’s a sizing issue or if the product description needs clarification.
Sales forecast
What it is: A WooCommerce sales report that provides the prediction of future sales based on historical data and trends.
Benefits: Aids in inventory planning, budgeting, and setting realistic growth targets.
Example: Based on last year’s data and current trends, the forecast predicts a 20% increase in summer sales, helping you prepare inventory and marketing campaigns accordingly.
SaaS reports
What it is: For subscription-based products, these reports track metrics like churn rate, lifetime value, and subscription renewal patterns.
Benefits: Crucial for managing and growing a subscription-based business model.
Example: You might see that customers who stay subscribed for more than three months have an 80% lower churn rate, encouraging you to focus on retaining customers through those critical first three months.
Gross and net sales
What it is: A clear breakdown of your total sales (gross) and your actual earnings after all costs and fees (net).
Benefits: Provides a true picture of your profitability and helps identify areas where costs could be reduced.
Example: You might see that while your gross sales are $100,000, your net sales are $70,000, prompting you to look for ways to reduce costs and increase profitability.
Fee reports
What it is: A detailed look at all the fees associated with your sales, such as payment processing fees, marketplace fees, or shipping costs.
Benefits: Helps you understand and optimize your fee structure to maximize profitability.
Example: You notice that credit card processing fees are significantly higher than PayPal fees, encouraging you to promote PayPal as a preferred payment method.
Reports by payment methods
What it is: A breakdown of sales by different payment options offered in your store.
Benefits: Helps you understand customer preferences and optimize your checkout process.
Example: You might discover that 60% of your customers prefer paying with PayPal, leading you to make PayPal more prominent in your checkout process.
Stock reports
What it is: Advanced inventory tracking that shows stock levels, reorder points, and sales velocity for each product.
Benefits: Helps prevent stockouts or overstocking, optimizing your inventory management.
Example: The report shows that you’re likely to run out of a popular item in two weeks based on current sales trends, prompting you to reorder immediately.
Date range sales reports
What it is: Flexible reporting that allows you to analyze sales data over any custom time period.
Benefits: Enables you to spot trends, compare performance across different timeframes, and measure the impact of specific events or campaigns.
Example: You can compare this year’s holiday season sales to last year’s, or see how a specific marketing campaign impacted sales during its run.
These advanced reports provide a wealth of information that can help you make data-driven decisions, optimize your operations, and grow your WooCommerce store more effectively.
How Putler fills the gaps in WooCommerce reporting
WooCommerce is a powerful eCommerce platform, but to truly excel in the competitive online marketplace, you need advanced WooCommerce reporting capabilities. Let’s explore some crucial WooCommerce advanced reports and how Putler takes them to the next level.
Comprehensive Sales Overview Report
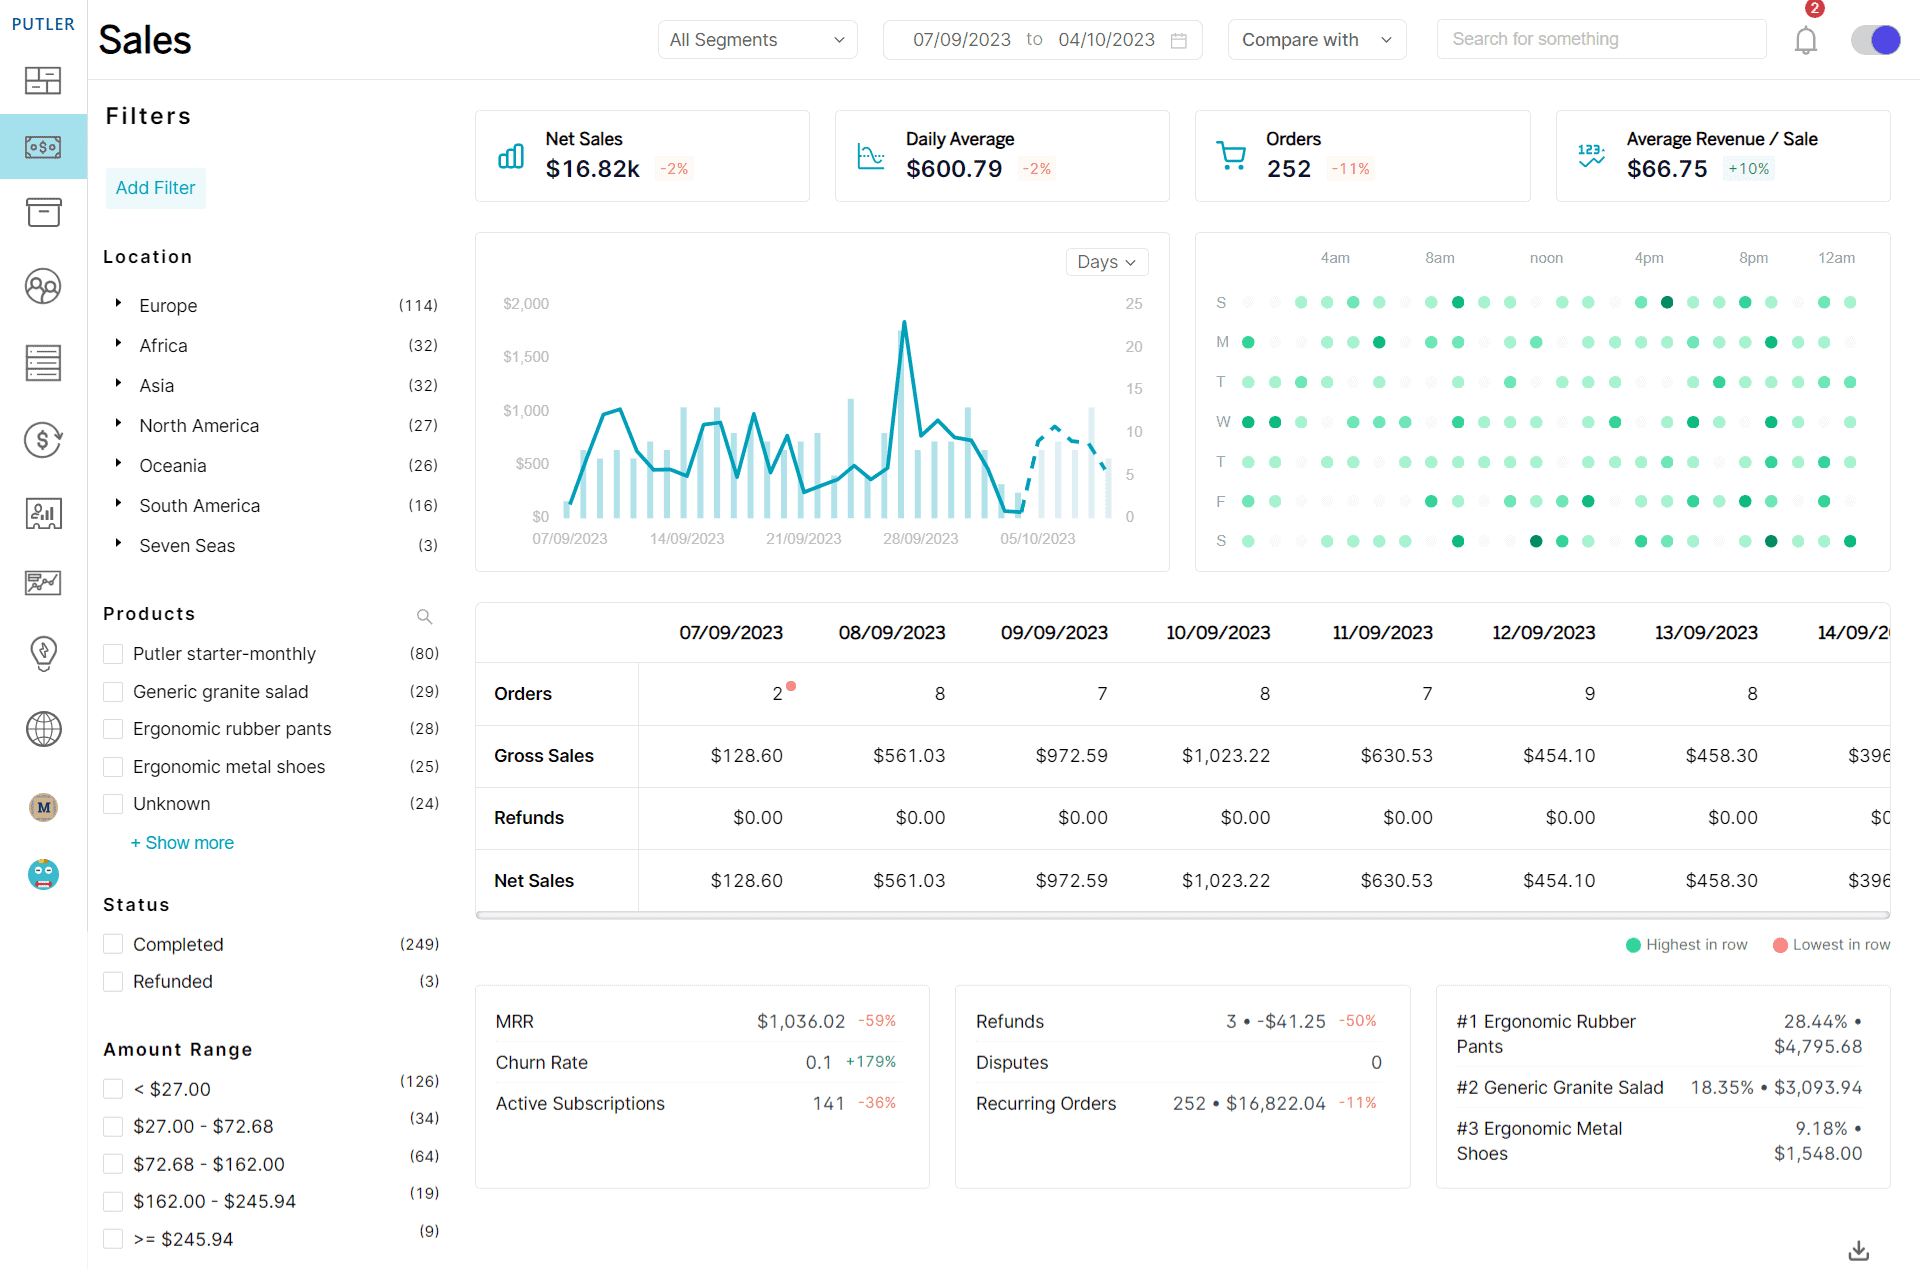
What it is: Putler’s WooCommerce Sales reports provide a holistic view of your store’s sales performance, including total revenue, number of orders, average order value, and sales trends over time and many other advanced metrics.
How it helps: It allows you to track your store’s overall health and identify sales patterns, enabling you to make informed decisions about inventory, pricing, and marketing strategies.
WooCommerce reports: Simple chart, basic metrics like gross sales, net sales, shipping amount, etc.
Putler’s edge: Putler integrates data from multiple sources, giving you a unified view of your sales across all platforms, not just WooCommerce. Our Sales Dashboard offers a dynamic sales chart and a unique sales heatmap to visualize your best-performing days and times.
Comprehensive Customer Overview Report
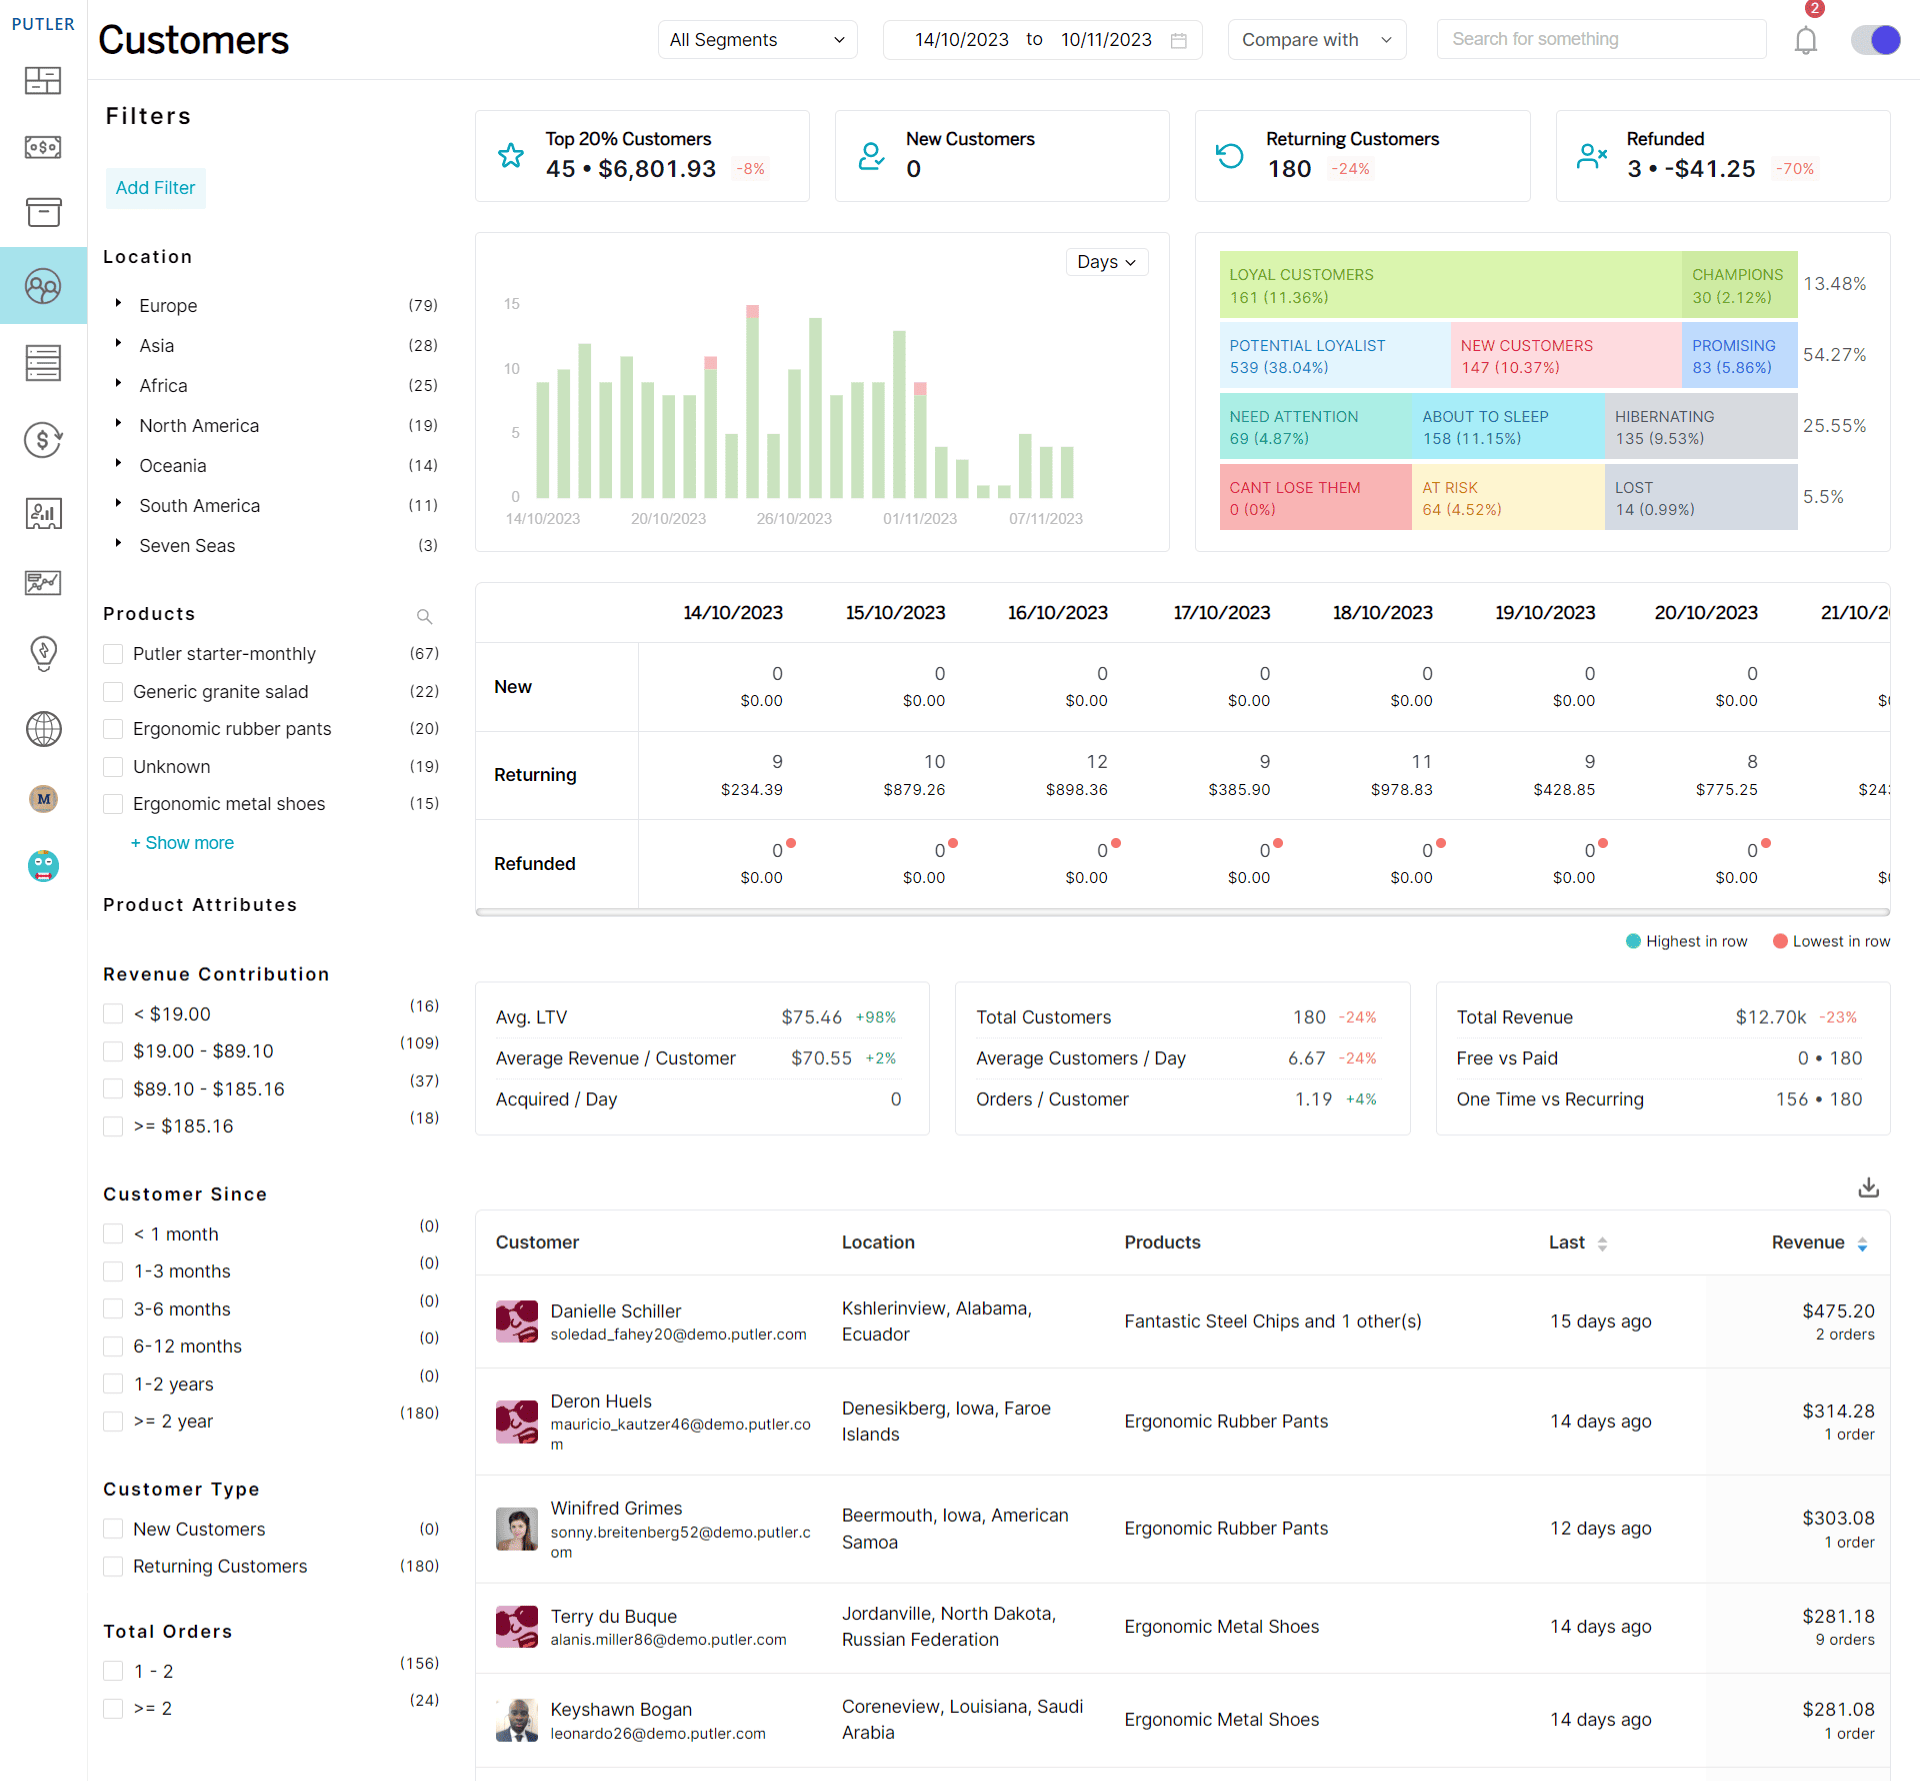
What it is: The Customer report offers insights into customer behavior, including new vs. returning customers, customer lifetime value, and purchase frequency.
How it helps: Understanding your customers is key to retention and growth. This report helps you identify your most valuable customers and tailor your marketing efforts accordingly.
WooCommerce reports: Only customer list and customer vs guest insight.
Putler’s edge: Putler’s Customers Dashboard goes beyond basic metrics with advanced RFM (Recency, Frequency, Monetary) analysis, segmenting your customers into actionable groups like “Champions,” “At Risk,” and “Hibernating.”
Advanced Customer Segmentation Report
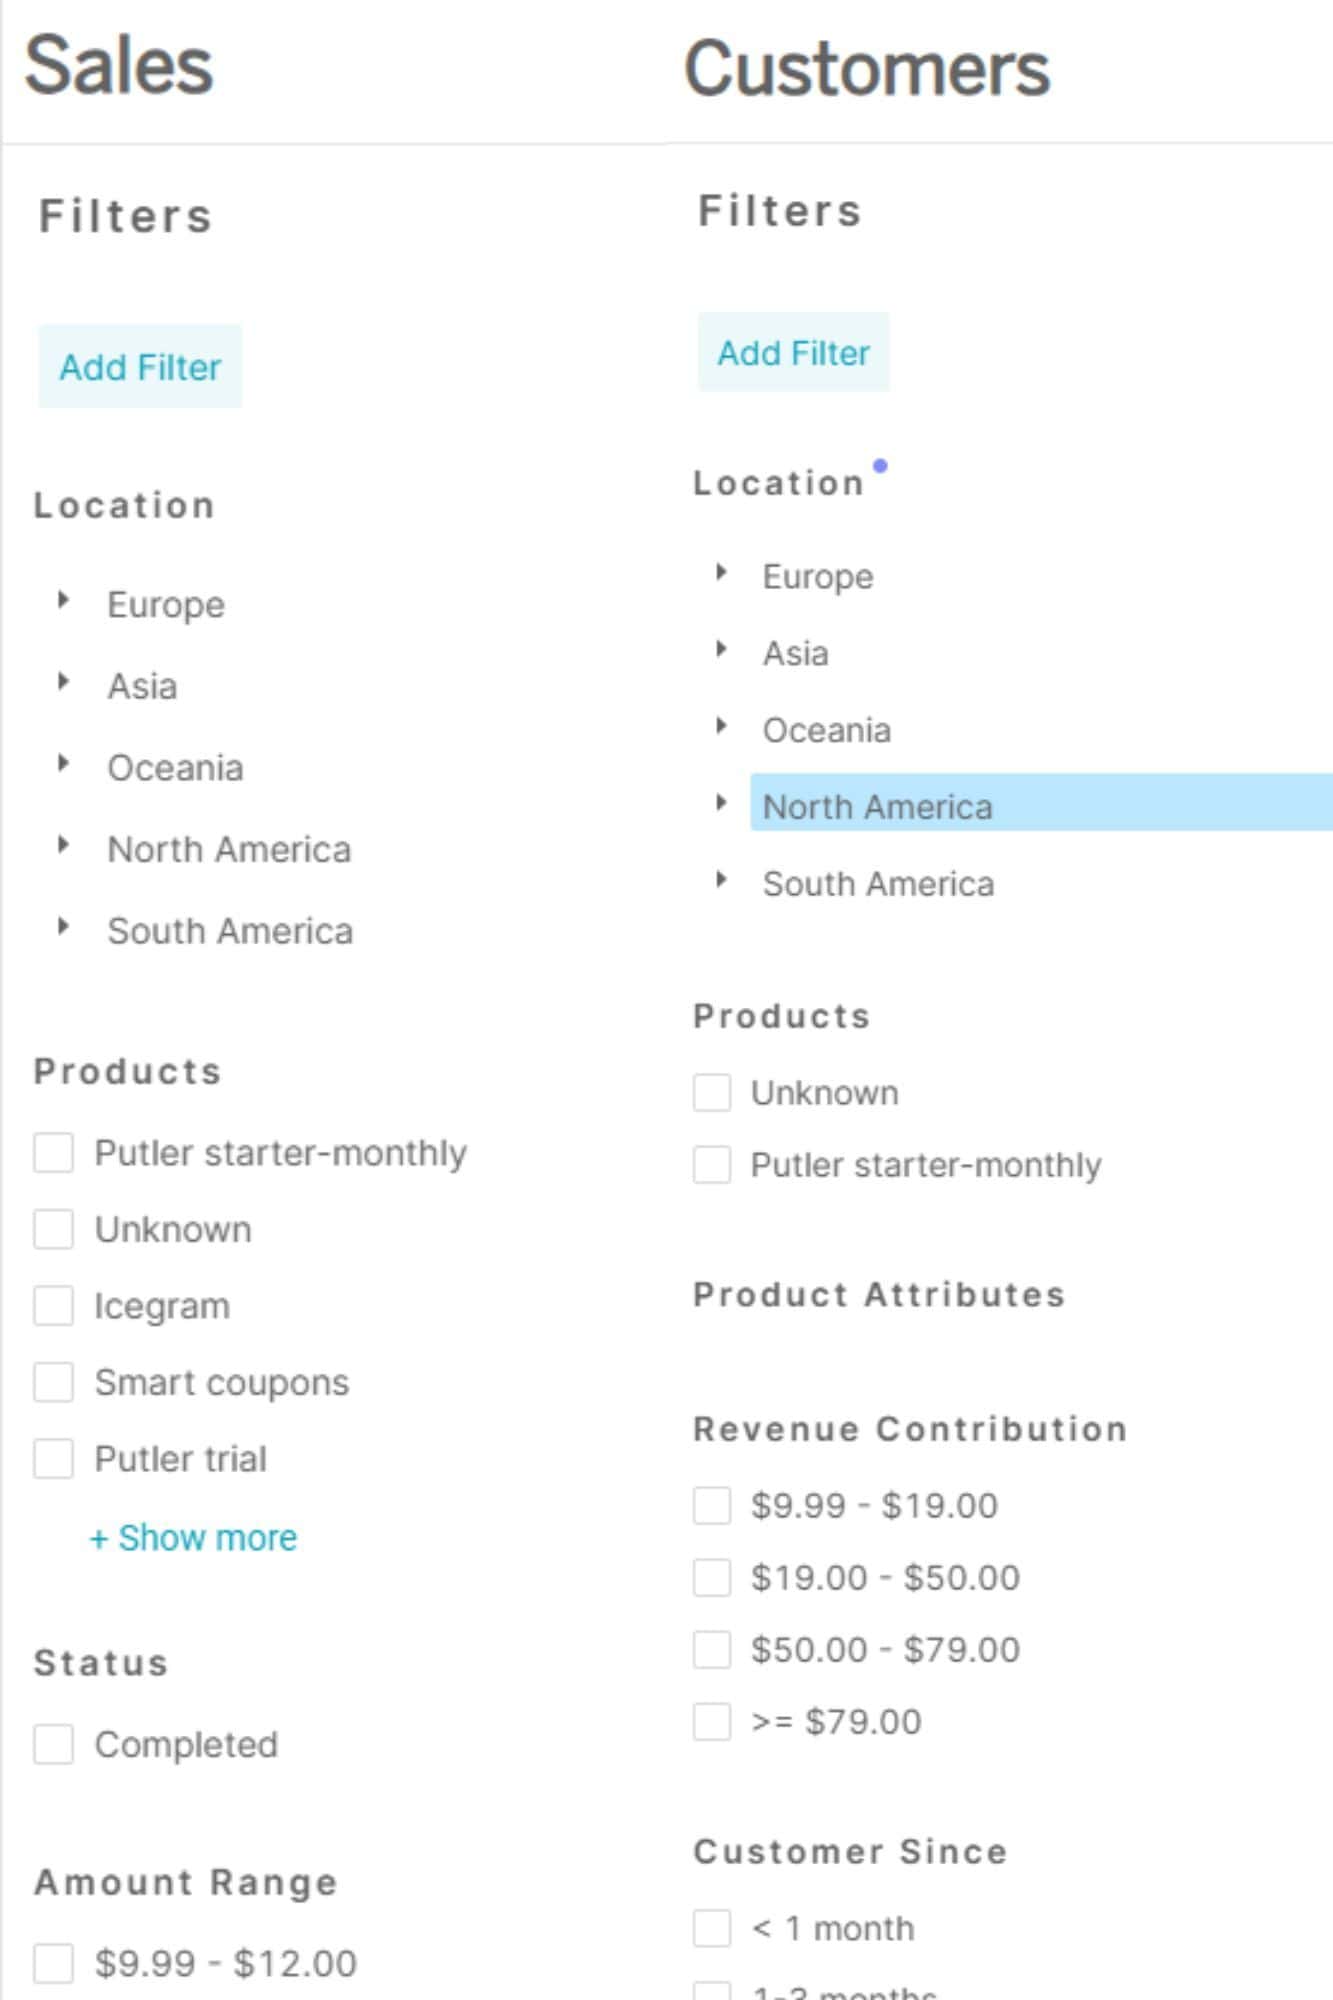
What it is: This report divides your customers into groups based on various criteria such as purchase history, demographics, or behavior.
How it helps: Segmentation allows for more targeted marketing campaigns and personalized customer experiences, potentially increasing conversion rates and customer loyalty.
WooCommerce reports: No advanced customer segmentation report.
Putler’s edge: Putler offers endless segmentation possibilities. You can segment customers based on location, product purchases, revenue contribution, and more, all with just a few clicks.
Detailed Product Performance Analytics
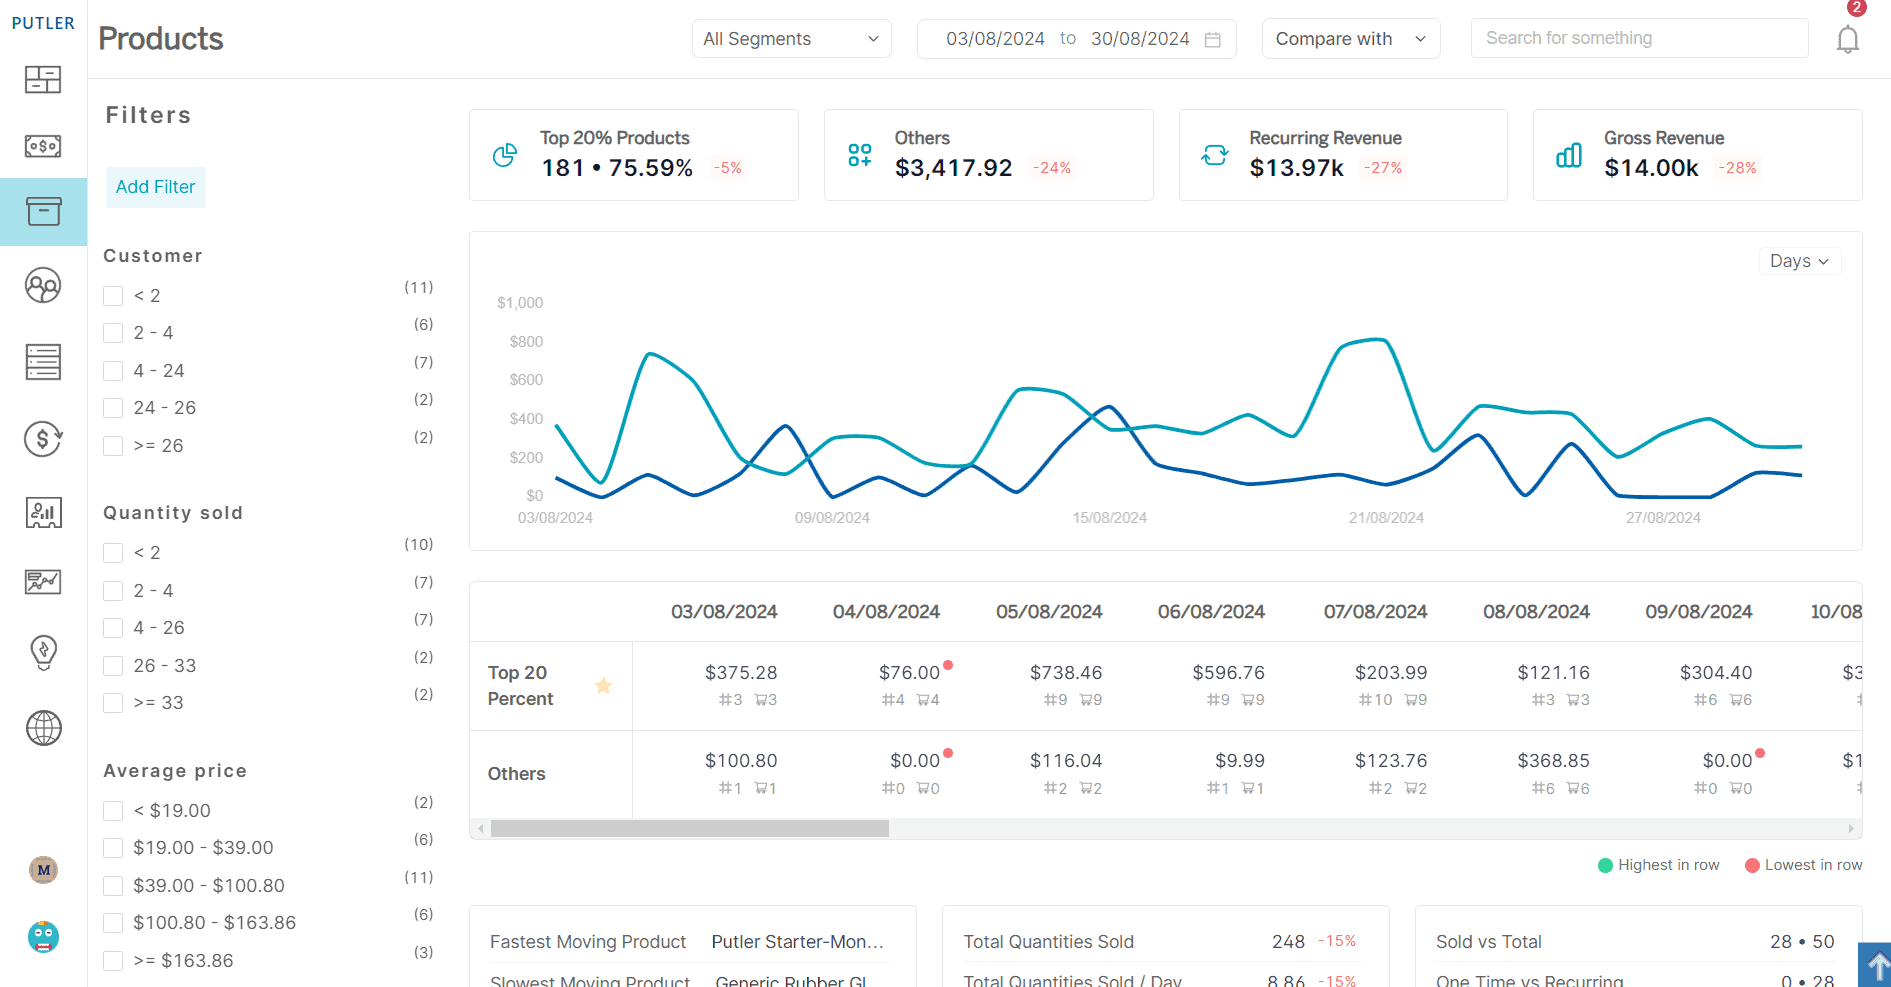
What it is: This report tracks the performance of individual products, including sales volume, revenue generated, and profit margins.
How it helps: It helps you identify your best and worst-performing products, guiding inventory decisions and highlighting opportunities for promotion or discontinuation.
WooCommerce reports: Only sales number by product report.
Putler’s edge: The Products Dashboard not only ranks products by performance but also identifies the fastest and slowest-moving products. Plus, our unique “Products Bought Together” feature uncovers valuable upselling opportunities.
Subscription and Recurring Revenue Metrics
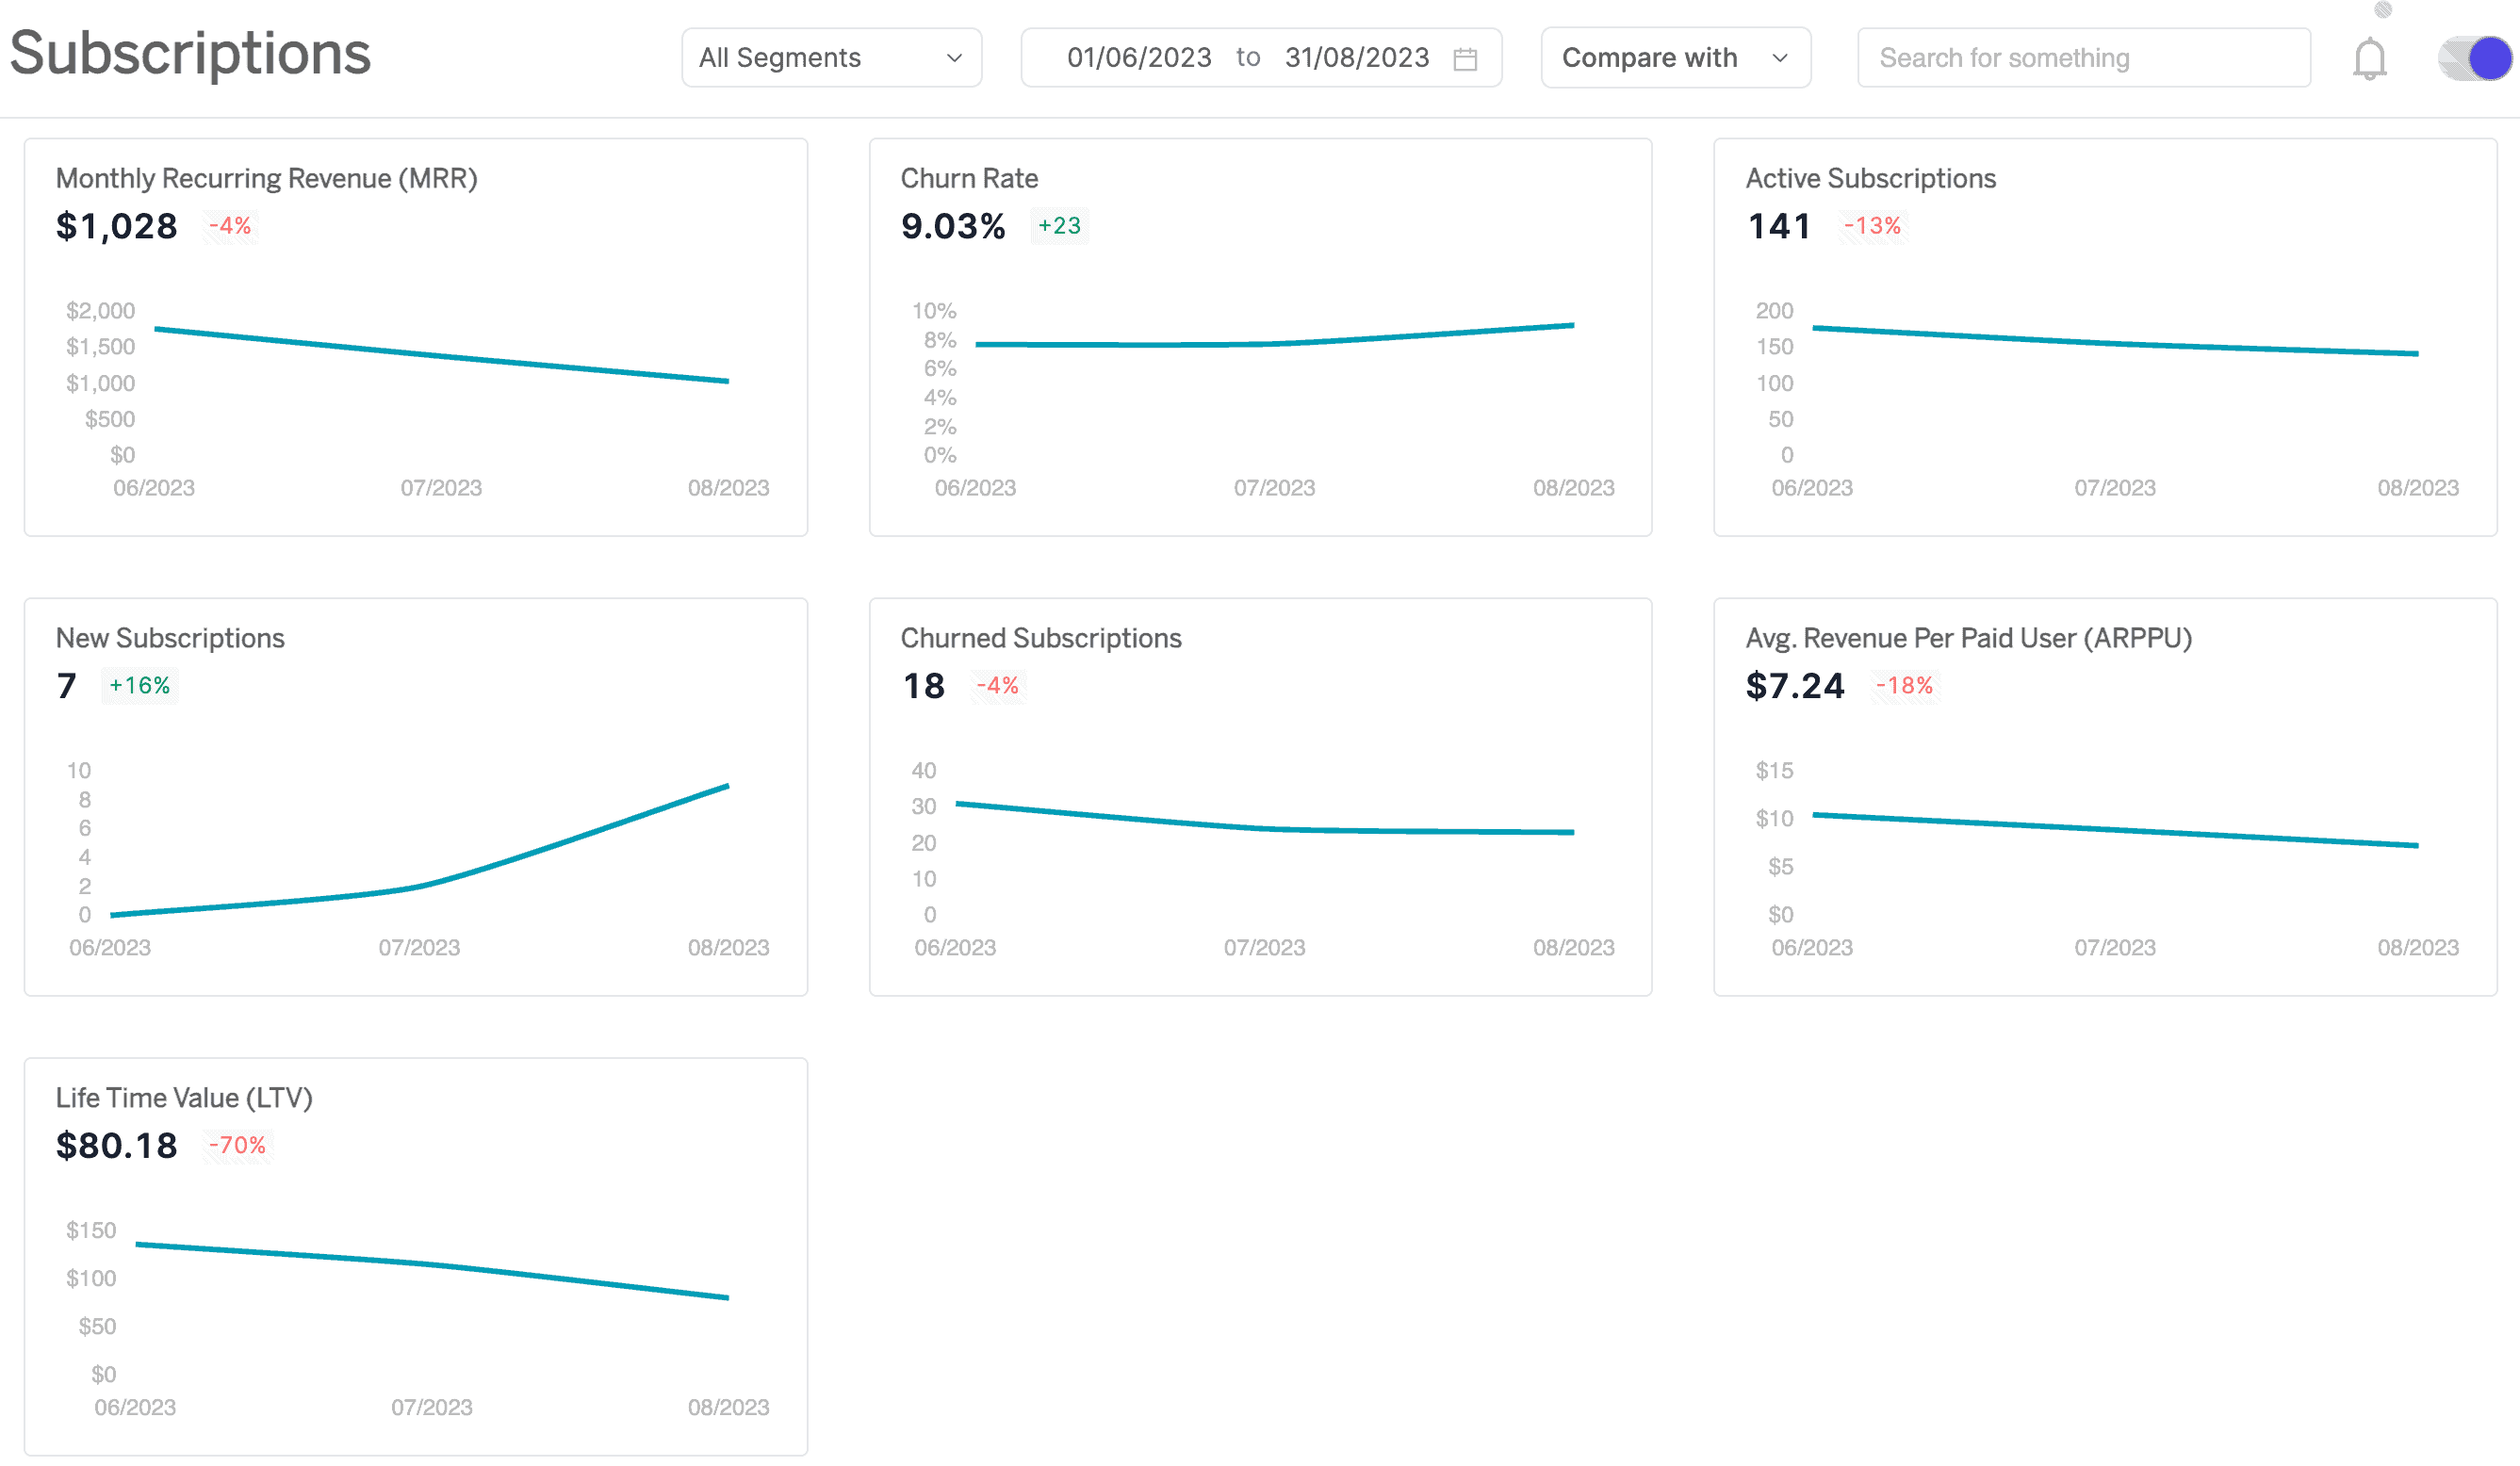
What it is: For stores offering subscriptions, Putler’s subscription report tracks metrics like Monthly Recurring Revenue (MRR), churn rate, and lifetime value of subscription customers.
How it helps: These metrics are crucial for subscription-based businesses to understand their growth, retention, and the long-term value of their customer base.
WooCommerce reports: No subscription and recurring revenue reports.
Putler’s edge: Putler’s Subscriptions Dashboard provides a comprehensive view of your subscription business, including MRR, ARR, LTV, churn rate, and more, all in one place.
Sales Forecast and Predictive Analytics
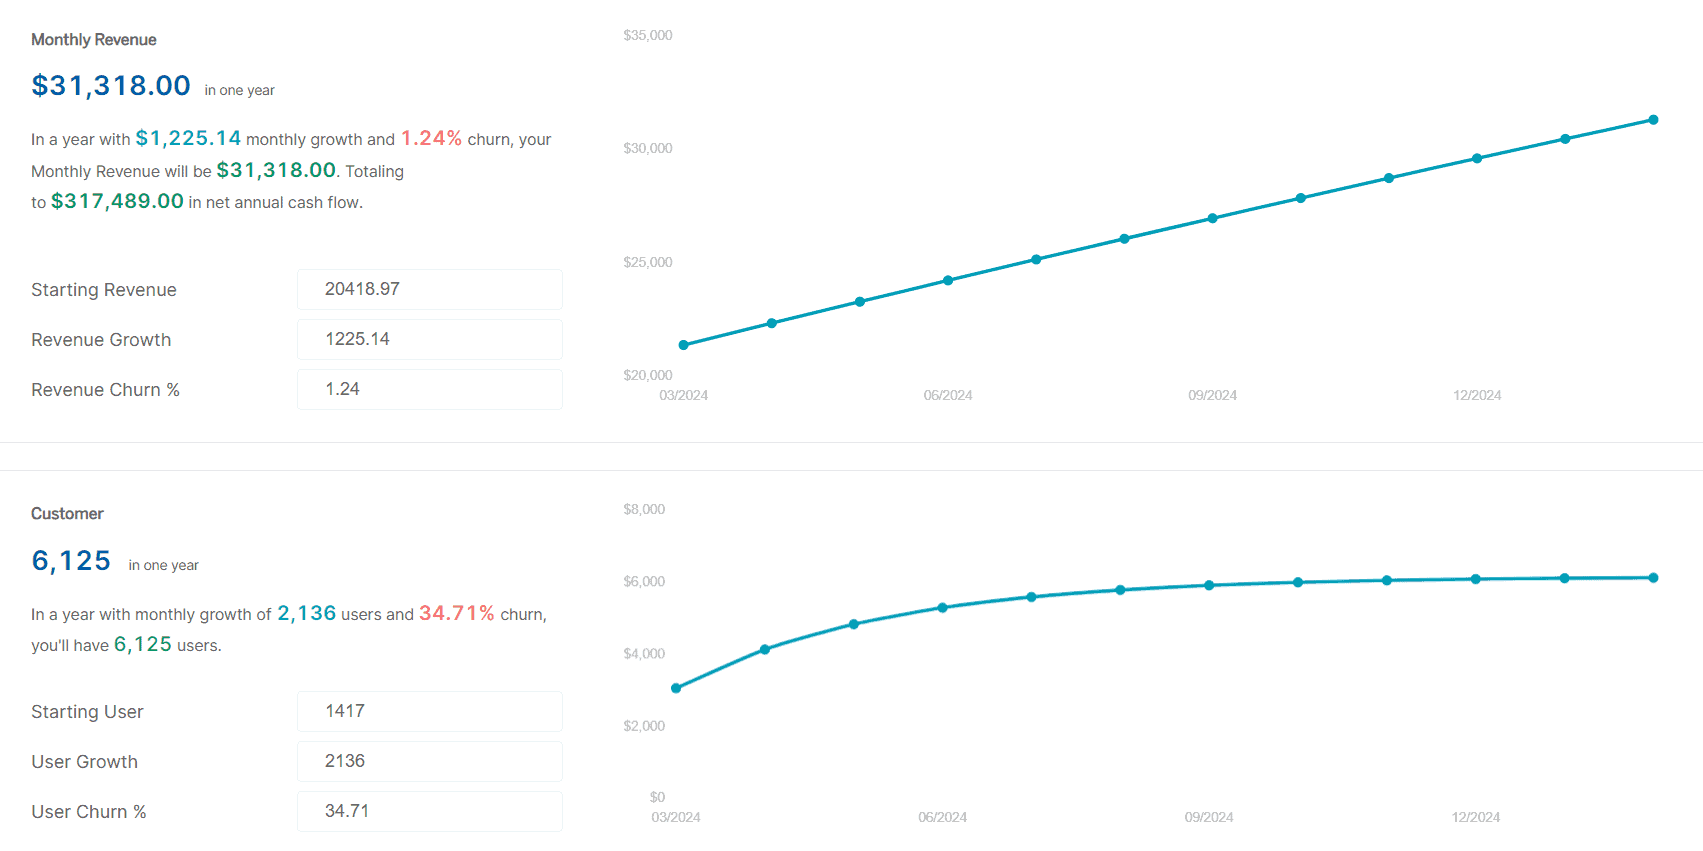
What it is: This forecast report uses historical data to predict future sales trends and revenue.
How it helps: Forecasting helps with inventory planning, cash flow management, and setting realistic growth targets.
WooCommerce reports: No sales forecast and predictive analytics available.
Putler’s edge: The Time Machine Dashboard offers not just basic forecasting, but also a 10x growth forecast and customer count predictions, helping you plan for explosive growth.
Refund and Dispute Analytics
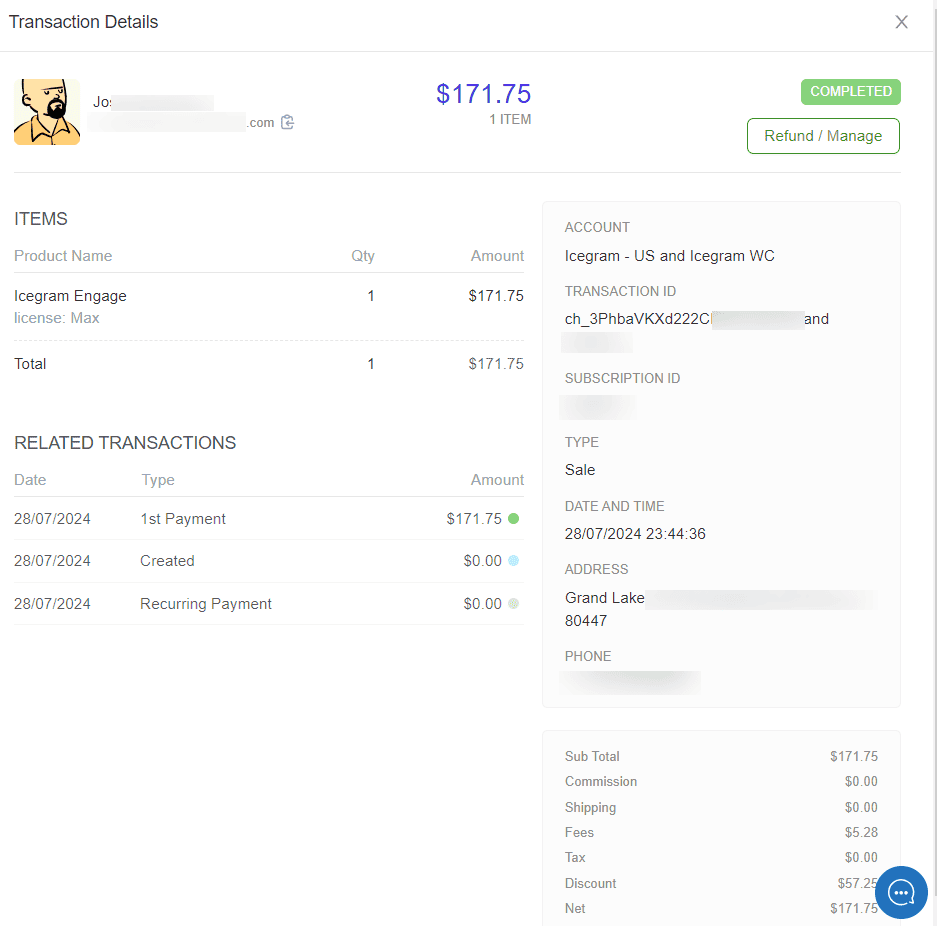
What it is: This report tracks refunds and disputes, including reasons and frequency.
How it helps: It helps identify problem areas in your products or processes, potentially reducing future refunds and improving customer satisfaction.
WooCommerce reports: Only shows the number of refunds, no refund processing capabilities.
Putler’s edge: Putler’s Transactions Dashboard not only provides detailed refund analytics but also allows you to process full or partial refunds directly from the dashboard, streamlining your operations.
Audience Behavior and Traffic Sources Report
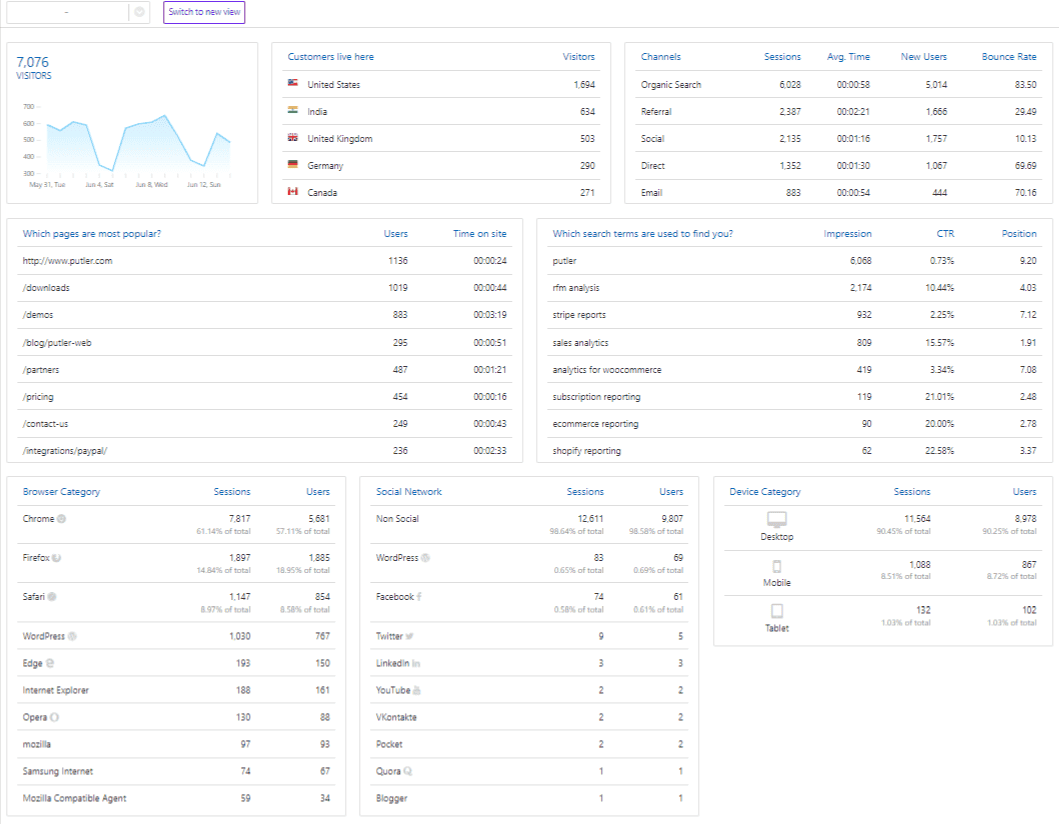
What it is: Putler’s Audience report shows where your visitors are coming from and how they interact with your site.
The privacy-friendly Web Analytics dashboard is Putler’s own alternative to GA. This new report provides important metrics such as unique visitors, page views, bounce rates, etc. along with in-depth insights into campaign performance, traffic sources, and more.
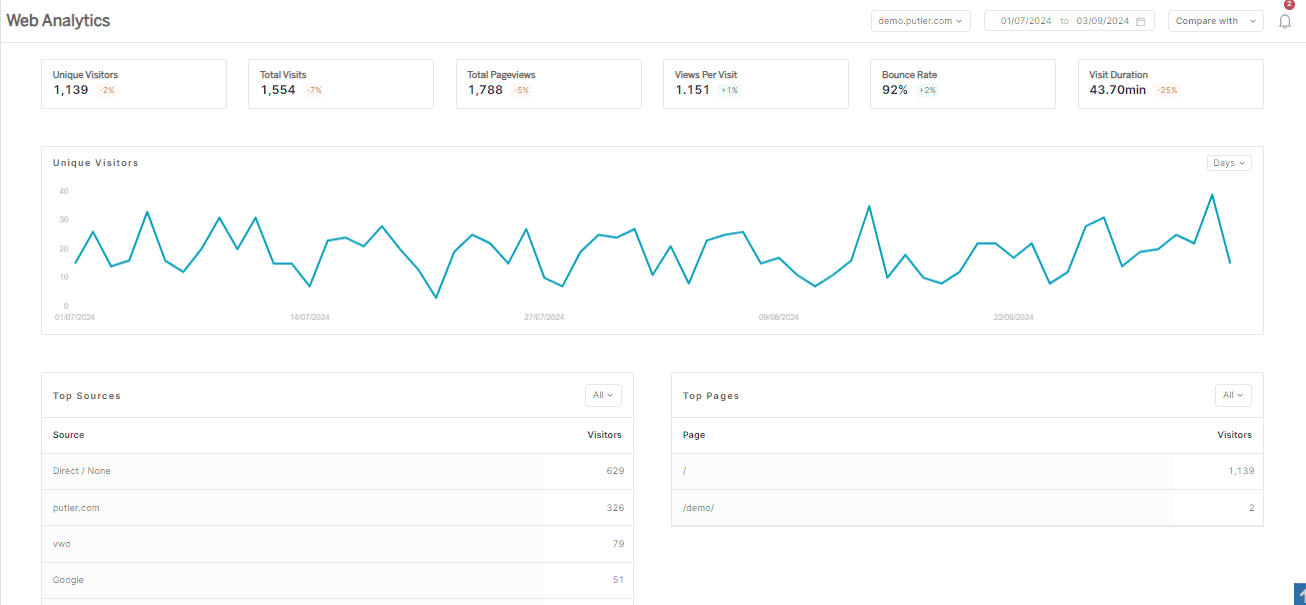
How it helps: Understanding website traffic and user behavior helps optimize your marketing efforts and improve site design for better conversions.
WooCommerce reports: No audience and traffic sources reports.
Putler’s edge: By fetching data from Google Analytics and Google Search Console, Putler provides a simplified view of your GA data. The Web Analytics dash provides more comprehensive view of your audience, including popular pages, search terms used to find your site, and more, while maintaining your data privacy.
Conclusion
Running a successful WooCommerce store isn’t just about having great products – it’s about understanding your business inside and out.
While basic WooCommerce reports are a start, Putler takes your analytics to the next level.
It analyzes your WooCommerce data to show you what’s working, what’s not, and where your best opportunities lie.
Putler lets you drill down into specific customer groups, products, or time periods. This level of detail helps you target your efforts where they’ll have the biggest impact.
It’s the extra edge your store needs to succeed.
